HYSETS (North America)
![]()
![]()
This notebook explores HYSETS dataset which was introduced by Arsenault et al., 2020.
[1]:
from ai4water.eda import EDA
from ai4water.datasets import HYSETS
from ai4water.utils.utils import get_version_info

import pandas as pd
import numpy as np

import matplotlib.pyplot as plt

from easy_mpl import hist, ridge
from easy_mpl import scatter
from easy_mpl.utils import process_cbar
**********Tensorflow models could not be imported **********
C:\Users\ather\.conda\envs\cat_aware\lib\site-packages\sklearn\experimental\enable_hist_gradient_boosting.py:15: UserWarning: Since version 1.0, it is not needed to import enable_hist_gradient_boosting anymore. HistGradientBoostingClassifier and HistGradientBoostingRegressor are now stable and can be normally imported from sklearn.ensemble.
  warnings.warn(
[2]:
for k,v in get_version_info().items():
    print(k, v)
python 3.8.17 (default, Jul  5 2023, 20:44:21) [MSC v.1916 64 bit (AMD64)]
os nt
ai4water 1.07
easy_mpl 0.21.3
SeqMetrics 1.3.4
numpy 1.24.3
pandas 1.3.4
matplotlib 3.6.0
sklearn 1.3.0
xarray 0.20.1
netCDF4 1.5.7
seaborn 0.12.2
[4]:
dataset = HYSETS(
    path=r"E:\data\gscad\HYSETS"   # set path to None if you have not already downloaded data
)
[5]:
dataset.start
[5]:
'19500101'
[6]:
dataset.end
[6]:
'20181231'
[7]:
stations = dataset.stations()
len(stations)
[7]:
14425
[8]:
dataset.plot_stations()
[8]:
<AxesSubplot: >
Static Data
[9]:
dataset.static_features
[9]:
['Source',
 'Name',
 'Official_ID',
 'Centroid_Lat_deg_N',
 'Centroid_Lon_deg_E',
 'Drainage_Area_km2',
 'Drainage_Area_GSIM_km2',
 'Flag_GSIM_boundaries',
 'Flag_Artificial_Boundaries',
 'Elevation_m',
 'Slope_deg',
 'Gravelius',
 'Perimeter',
 'Flag_Shape_Extraction',
 'Aspect_deg',
 'Flag_Terrain_Extraction',
 'Land_Use_Forest_frac',
 'Land_Use_Grass_frac',
 'Land_Use_Wetland_frac',
 'Land_Use_Water_frac',
 'Land_Use_Urban_frac',
 'Land_Use_Shrubs_frac',
 'Land_Use_Crops_frac',
 'Land_Use_Snow_Ice_frac',
 'Flag_Land_Use_Extraction',
 'Permeability_logk_m2',
 'Porosity_frac',
 'Flag_Subsoil_Extraction']
[10]:
q = ''
lc01 = ''
nvis = ''
anngro = ''
gromega = ''
npp = ''
[11]:
static = dataset.fetch_static_features(stn_id=stations)
static.shape
[11]:
(14425, 28)
[12]:
EDA(data=static, save=False).heatmap()
[12]:
<AxesSubplot: ylabel='Examples'>
[13]:
physical_features = []
soil_features = []
geological_features = []
flow_characteristics = []
[14]:
static = static.dropna(axis=1)
static.shape
[14]:
(14425, 12)
[15]:
[16]:
idx = 0
ax_num = 0

fig, axes = plt.subplots(5, 5, figsize=(15, 12))
axes = axes.flatten()

while ax_num < 25 and idx<static.shape[1]:

    val = static.iloc[:, idx]
    idx += 1

    try:
        c = val.astype(float).values.reshape(-1,)

        en = static.shape[0]
        ax = axes[ax_num]
        ax, sc = scatter(long[0:en], lat[0:en], c=c[0:en], cmap="hot", show=False, ax=ax)

        process_cbar(ax, sc, border=False, title=val.name, #title_kws ={"fontsize": 14}
                    )
        ax_num += 1
    except ValueError:
        continue

plt.tight_layout()
plt.show()
print(idx)
12
Dynamic Features
[17]:
dataset.dynamic_features
[17]:
['discharge', 'swe', 'tasmin', 'tasmax', 'pr']
Streamflow
[32]:
streamflow = dataset.fetch(400, dynamic_features = 'discharge', as_dataframe=True)
streamflow = streamflow.reset_index()
streamflow.index = pd.to_datetime(streamflow.pop('time'))
streamflow.pop('dynamic_features')
streamflow.shape
[32]:
(25202, 400)
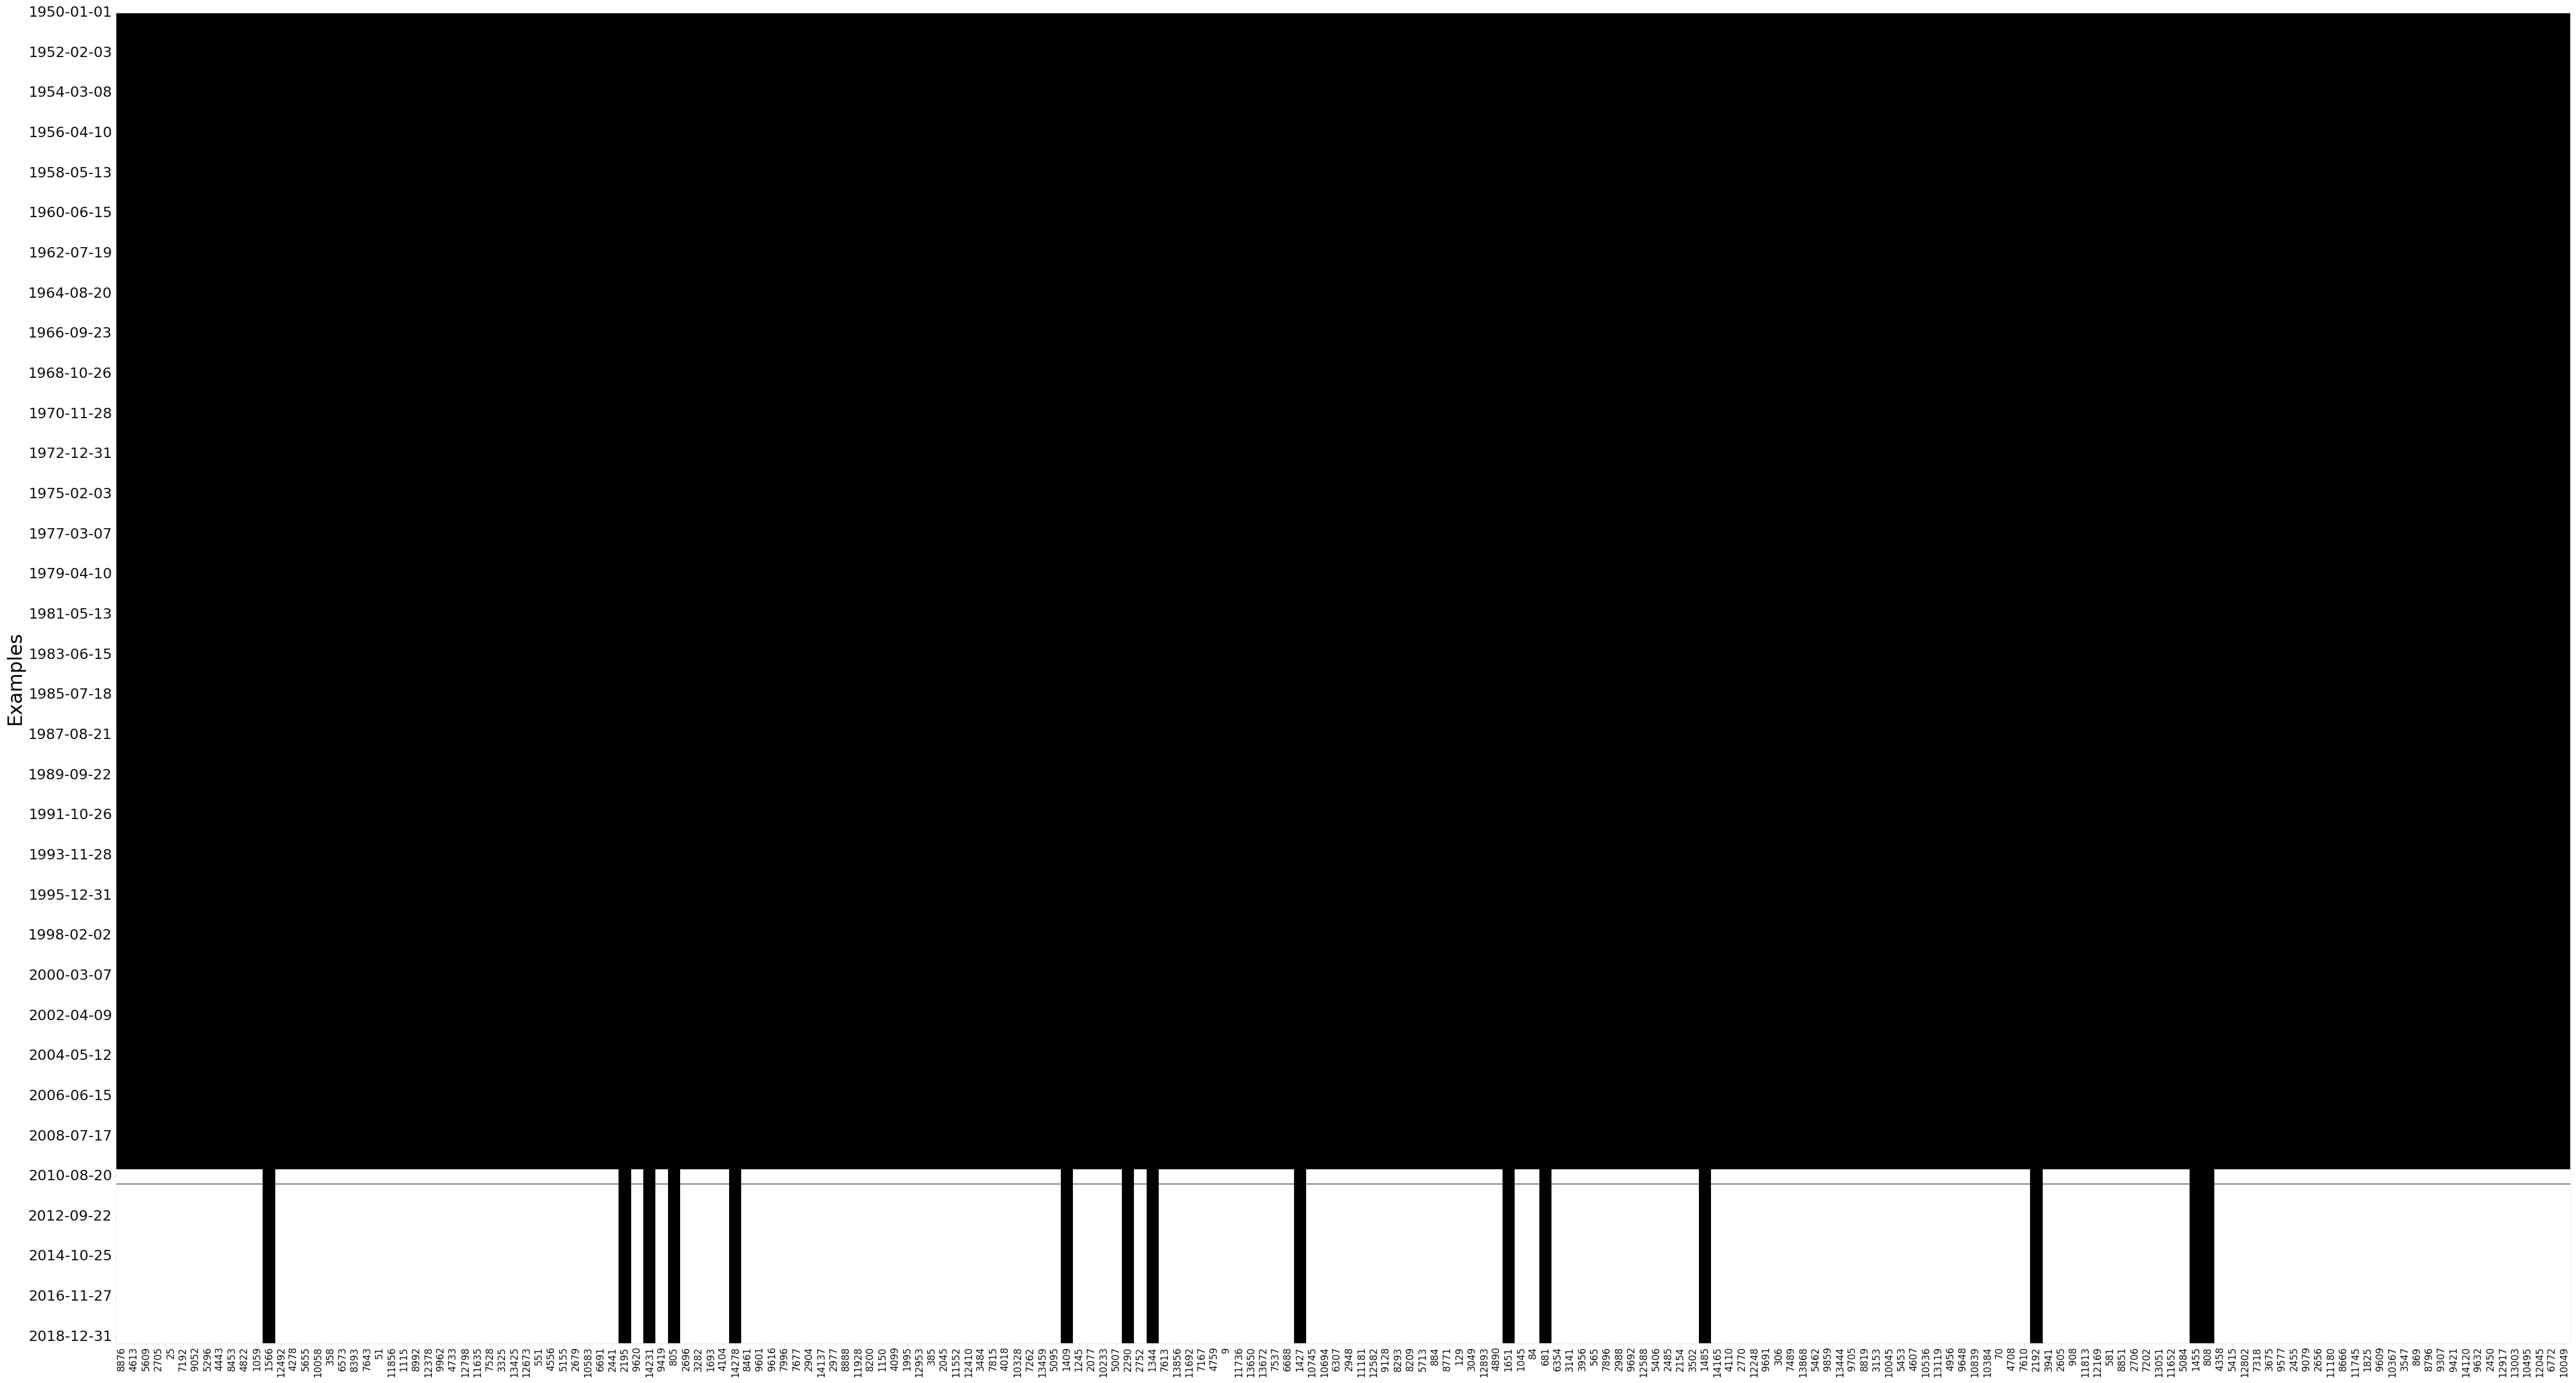
[33]:
EDA(data=streamflow, save=False).heatmap()
[33]:
<Axes: ylabel='Examples'>
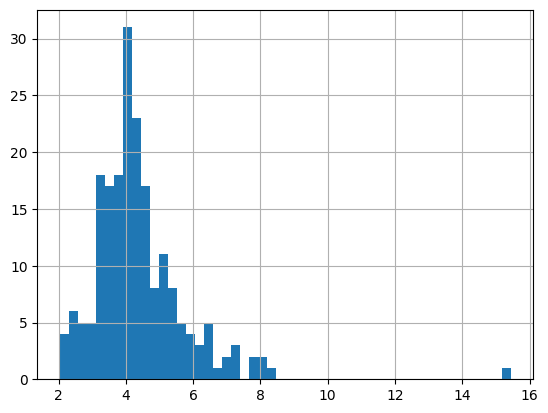
[23]:
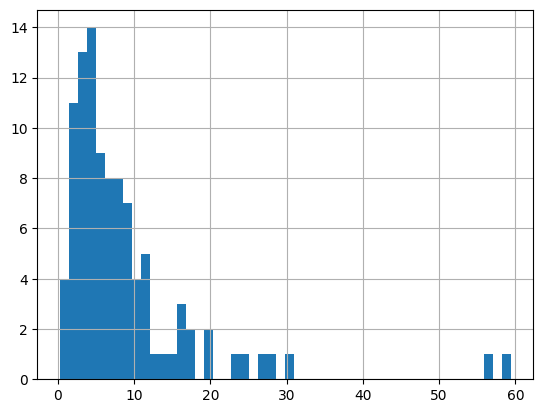
# skewness of streamflow

_ = hist(streamflow.skew().values.reshape(-1,), bins=50)
Snow Water Equivalent
[24]:
swe = dataset.fetch(200, dynamic_features = 'swe', as_dataframe=True)
swe = swe.reset_index()
swe.index = pd.to_datetime(swe.pop('time'))
swe.pop('dynamic_features')
print(swe.shape)
EDA(data=swe, save=False).heatmap()
(25202, 200)
[24]:
<Axes: ylabel='Examples'>
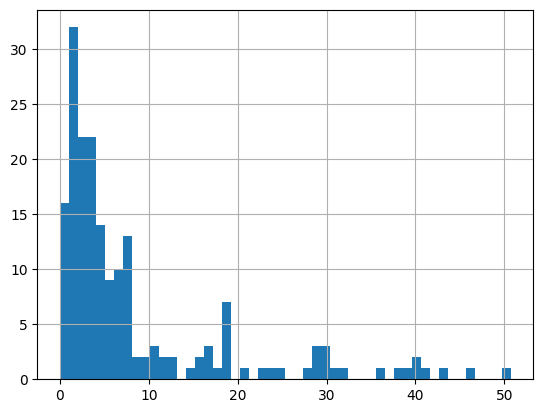
[26]:
_ = hist(swe.skew().values.reshape(-1,), bins=50)
Air Temperature
[28]:
tmax = dataset.fetch(200, dynamic_features = 'tasmax', as_dataframe=True)
tmax = tmax.reset_index()
tmax.index = pd.to_datetime(tmax.pop('time'))
tmax.pop('dynamic_features')
print(tmax.shape)

tmin = dataset.fetch(200, dynamic_features = 'tasmin', as_dataframe=True)
tmin = tmin.reset_index()
tmin.index = pd.to_datetime(tmin.pop('time'))
tmin.pop('dynamic_features')
print(tmin.shape)

tavg = np.mean([tmax.values, tmin.values], axis=0)
print(tavg.shape)

tavg = pd.DataFrame(tavg, index = tmin.index, columns=tmin.columns.tolist())
print(tavg.shape)

EDA(data=tavg, save=False).heatmap()
(25202, 200)
(25202, 200)
(25202, 200)
(25202, 200)

[28]:
<Axes: ylabel='Examples'>
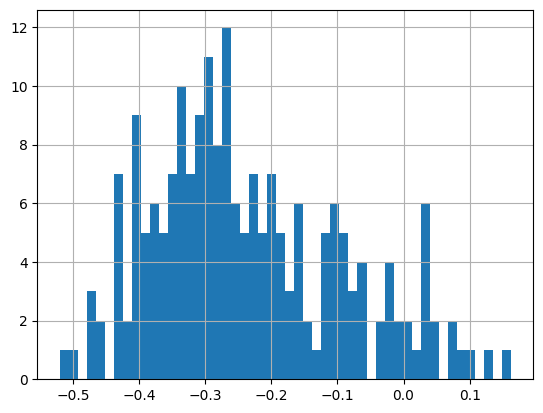
[29]:
_ = hist(tavg.skew().values.reshape(-1,), bins=50)
Precipitation
[30]:
pcp = dataset.fetch(200, dynamic_features = 'pr', as_dataframe=True)
pcp = pcp.reset_index()
pcp.index = pd.to_datetime(pcp.pop('time'))
pcp.pop('dynamic_features')
print(pcp.shape)
EDA(data=pcp, save=False).heatmap()
(25202, 200)

[30]:
<Axes: ylabel='Examples'>
[31]:
_ = hist(pcp.skew().values.reshape(-1,), bins=50)
[69]: