CAMELS Denmark
![]()
![]()
This notebook explores CAMELS Denmark dataset.
[1]:
from ai4water.eda import EDA
from ai4water.datasets import CAMELS_DK
from ai4water.utils.utils import get_version_info

import pandas as pd

import matplotlib.pyplot as plt

from easy_mpl import scatter
from easy_mpl import hist
from easy_mpl.utils import process_cbar
**********Tensorflow models could not be imported **********
C:\Users\ather\.conda\envs\cat_aware\lib\site-packages\sklearn\experimental\enable_hist_gradient_boosting.py:15: UserWarning: Since version 1.0, it is not needed to import enable_hist_gradient_boosting anymore. HistGradientBoostingClassifier and HistGradientBoostingRegressor are now stable and can be normally imported from sklearn.ensemble.
  warnings.warn(
[2]:
for k,v in get_version_info().items():
    print(k, v)
python 3.8.17 (default, Jul  5 2023, 20:44:21) [MSC v.1916 64 bit (AMD64)]
os nt
ai4water 1.07
easy_mpl 0.21.3
SeqMetrics 1.3.4
numpy 1.24.3
pandas 1.3.4
matplotlib 3.6.0
sklearn 1.3.0
xarray 0.20.1
netCDF4 1.5.7
seaborn 0.12.2
[3]:
dataset = CAMELS_DK(
     path=r"E:\data\gscad\CAMELS\CAMELS_DK"    # set path to None if you have not already downloaded data
)
    Not downloading the data since the directory
    E:\data\gscad\CAMELS\CAMELS_DK already exists.
    Use overwrite=True to remove previously saved files and download again
[4]:
dataset.start
[4]:
Timestamp('1981-01-02 00:00:00')
[5]:
dataset.end
[5]:
Timestamp('2020-12-31 00:00:00')
[6]:
stations = dataset.stations()
len(stations)
[6]:
308
Static Data
[7]:
dataset.static_features
[7]:
['p_mean',
 'pet_mean',
 'aridity',
 'frac_snow',
 'moisture_index',
 'seasonality',
 'high_prec_freq',
 'high_prec_dur',
 'low_prec_freq',
 'low_prec_dur',
 'gauge_name',
 'country',
 'gauge_lat',
 'gauge_lon',
 'area',
 'sgr_dk_sav',
 'glc_pc_s06',
 'glc_pc_s07',
 'nli_ix_sav',
 'glc_pc_s04',
 'glc_pc_s05',
 'glc_pc_s02',
 'glc_pc_s03',
 'glc_pc_s01',
 'pet_mm_syr',
 'glc_pc_s08',
 'glc_pc_s09',
 'swc_pc_s09',
 'ele_mt_smx',
 'tbi_cl_smj',
 'swc_pc_s01',
 'swc_pc_s02',
 'swc_pc_s03',
 'swc_pc_s04',
 'swc_pc_s05',
 'swc_pc_s06',
 'swc_pc_s07',
 'swc_pc_s08',
 'crp_pc_sse',
 'glc_pc_s22',
 'glc_pc_s20',
 'glc_pc_s21',
 'wet_pc_sg1',
 'wet_pc_sg2',
 'pac_pc_sse',
 'swc_pc_s10',
 'swc_pc_s11',
 'swc_pc_s12',
 'clz_cl_smj',
 'gwt_cm_sav',
 'glc_pc_s17',
 'glc_pc_s18',
 'hft_ix_s93',
 'glc_pc_s15',
 'ire_pc_sse',
 'glc_pc_s16',
 'glc_pc_s13',
 'prm_pc_sse',
 'glc_pc_s14',
 'glc_pc_s11',
 'glc_pc_s12',
 'glc_pc_s10',
 'kar_pc_sse',
 'slp_dg_sav',
 'glc_pc_s19',
 'tmp_dc_s07',
 'tmp_dc_s08',
 'tmp_dc_s05',
 'tmp_dc_s06',
 'tmp_dc_s09',
 'for_pc_sse',
 'aet_mm_s06',
 'aet_mm_s05',
 'aet_mm_s08',
 'aet_mm_s07',
 'aet_mm_s09',
 'tmp_dc_s10',
 'tmp_dc_s11',
 'aet_mm_s02',
 'aet_mm_s01',
 'tmp_dc_s12',
 'aet_mm_s04',
 'aet_mm_s03',
 'lit_cl_smj',
 'tmp_dc_s03',
 'tmp_dc_s04',
 'tmp_dc_s01',
 'tmp_dc_s02',
 'cls_cl_smj',
 'pre_mm_syr',
 'pnv_pc_s01',
 'pnv_pc_s04',
 'pnv_pc_s05',
 'pnv_pc_s02',
 'rdd_mk_sav',
 'ele_mt_smn',
 'pnv_pc_s03',
 'pnv_pc_s08',
 'pnv_pc_s09',
 'pnv_pc_s06',
 'pnv_pc_s07',
 'wet_cl_smj',
 'snw_pc_syr',
 'pnv_pc_s11',
 'pnv_pc_s12',
 'pnv_pc_s10',
 'pnv_pc_s15',
 'pnv_pc_s13',
 'pnv_pc_s14',
 'cmi_ix_syr',
 'pet_mm_s11',
 'pet_mm_s12',
 'pet_mm_s10',
 'tmp_dc_smn',
 'wet_pc_s08',
 'wet_pc_s09',
 'slt_pc_sav',
 'wet_pc_s02',
 'wet_pc_s03',
 'wet_pc_s01',
 'hdi_ix_sav',
 'wet_pc_s06',
 'wet_pc_s07',
 'wet_pc_s04',
 'wet_pc_s05',
 'fec_cl_smj',
 'glc_cl_smj',
 'swc_pc_syr',
 'hft_ix_s09',
 'soc_th_sav',
 'gdp_ud_sav',
 'gdp_ud_ssu',
 'tmp_dc_smx',
 'cly_pc_sav',
 'pet_mm_s02',
 'pet_mm_s03',
 'pet_mm_s01',
 'snw_pc_smx',
 'ppd_pk_sav',
 'pet_mm_s08',
 'aet_mm_s11',
 'pet_mm_s09',
 'aet_mm_s10',
 'pet_mm_s06',
 'pet_mm_s07',
 'aet_mm_s12',
 'pet_mm_s04',
 'pet_mm_s05',
 'inu_pc_slt',
 'ero_kh_sav',
 'aet_mm_syr',
 'cmi_ix_s10',
 'cmi_ix_s11',
 'cmi_ix_s12',
 'ari_ix_sav',
 'tmp_dc_syr',
 'tec_cl_smj',
 'fmh_cl_smj',
 'inu_pc_smn',
 'pnv_cl_smj',
 'pre_mm_s08',
 'pre_mm_s09',
 'run_mm_syr',
 'pre_mm_s06',
 'pre_mm_s07',
 'pre_mm_s04',
 'pre_mm_s05',
 'snd_pc_sav',
 'pre_mm_s02',
 'pre_mm_s03',
 'ele_mt_sav',
 'pre_mm_s01',
 'urb_pc_sse',
 'lka_pc_sse',
 'pre_mm_s10',
 'snw_pc_s01',
 'snw_pc_s02',
 'snw_pc_s03',
 'snw_pc_s04',
 'snw_pc_s05',
 'snw_pc_s06',
 'gla_pc_sse',
 'snw_pc_s07',
 'snw_pc_s08',
 'snw_pc_s09',
 'inu_pc_smx',
 'pre_mm_s11',
 'pre_mm_s12',
 'cmi_ix_s07',
 'cmi_ix_s08',
 'cmi_ix_s05',
 'cmi_ix_s06',
 'cmi_ix_s09',
 'snw_pc_s10',
 'snw_pc_s11',
 'snw_pc_s12',
 'cmi_ix_s03',
 'cmi_ix_s04',
 'cmi_ix_s01',
 'cmi_ix_s02',
 'pst_pc_sse',
 'dis_m3_pmn',
 'dis_m3_pmx',
 'dis_m3_pyr',
 'lkv_mc_usu',
 'rev_mc_usu',
 'ria_ha_usu',
 'riv_tc_usu',
 'pop_ct_usu',
 'dor_pc_pva',
 'area_fraction_used_for_aggregation']
[10]:
dataset.plot_stations()
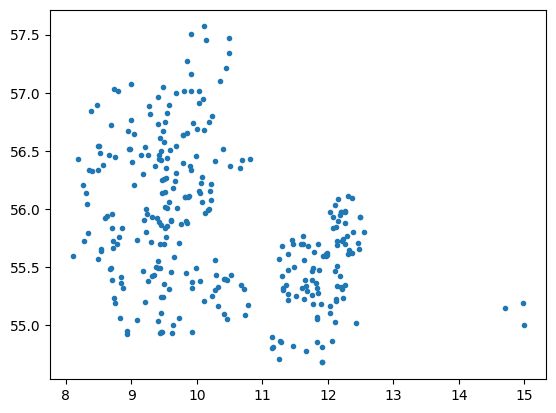
[10]:
<AxesSubplot: >
[11]:
coords = dataset.stn_coords()
coords
[11]:
| lat | long | |
|---|---|---|
| 100006 | 56.82558 | 9.55018 |
| 100009 | 56.89105 | 9.57428 |
| 100010 | 57.01044 | 9.90870 |
| 100011 | 57.01597 | 10.02637 |
| 100013 | 56.96435 | 9.40853 |
| ... | ... | ... |
| 80001 | 57.10371 | 10.35160 |
| 90001 | 57.01642 | 8.78869 |
| 90015 | 57.03193 | 8.73478 |
| 90021 | 57.04597 | 9.48887 |
| 90022 | 57.07303 | 8.98794 |
308 rows × 2 columns
[12]:
static = dataset.fetch_static_features(stn_id=stations)
static.shape
[12]:
(308, 211)
[13]:
_ = EDA(data=static, save=False).heatmap()
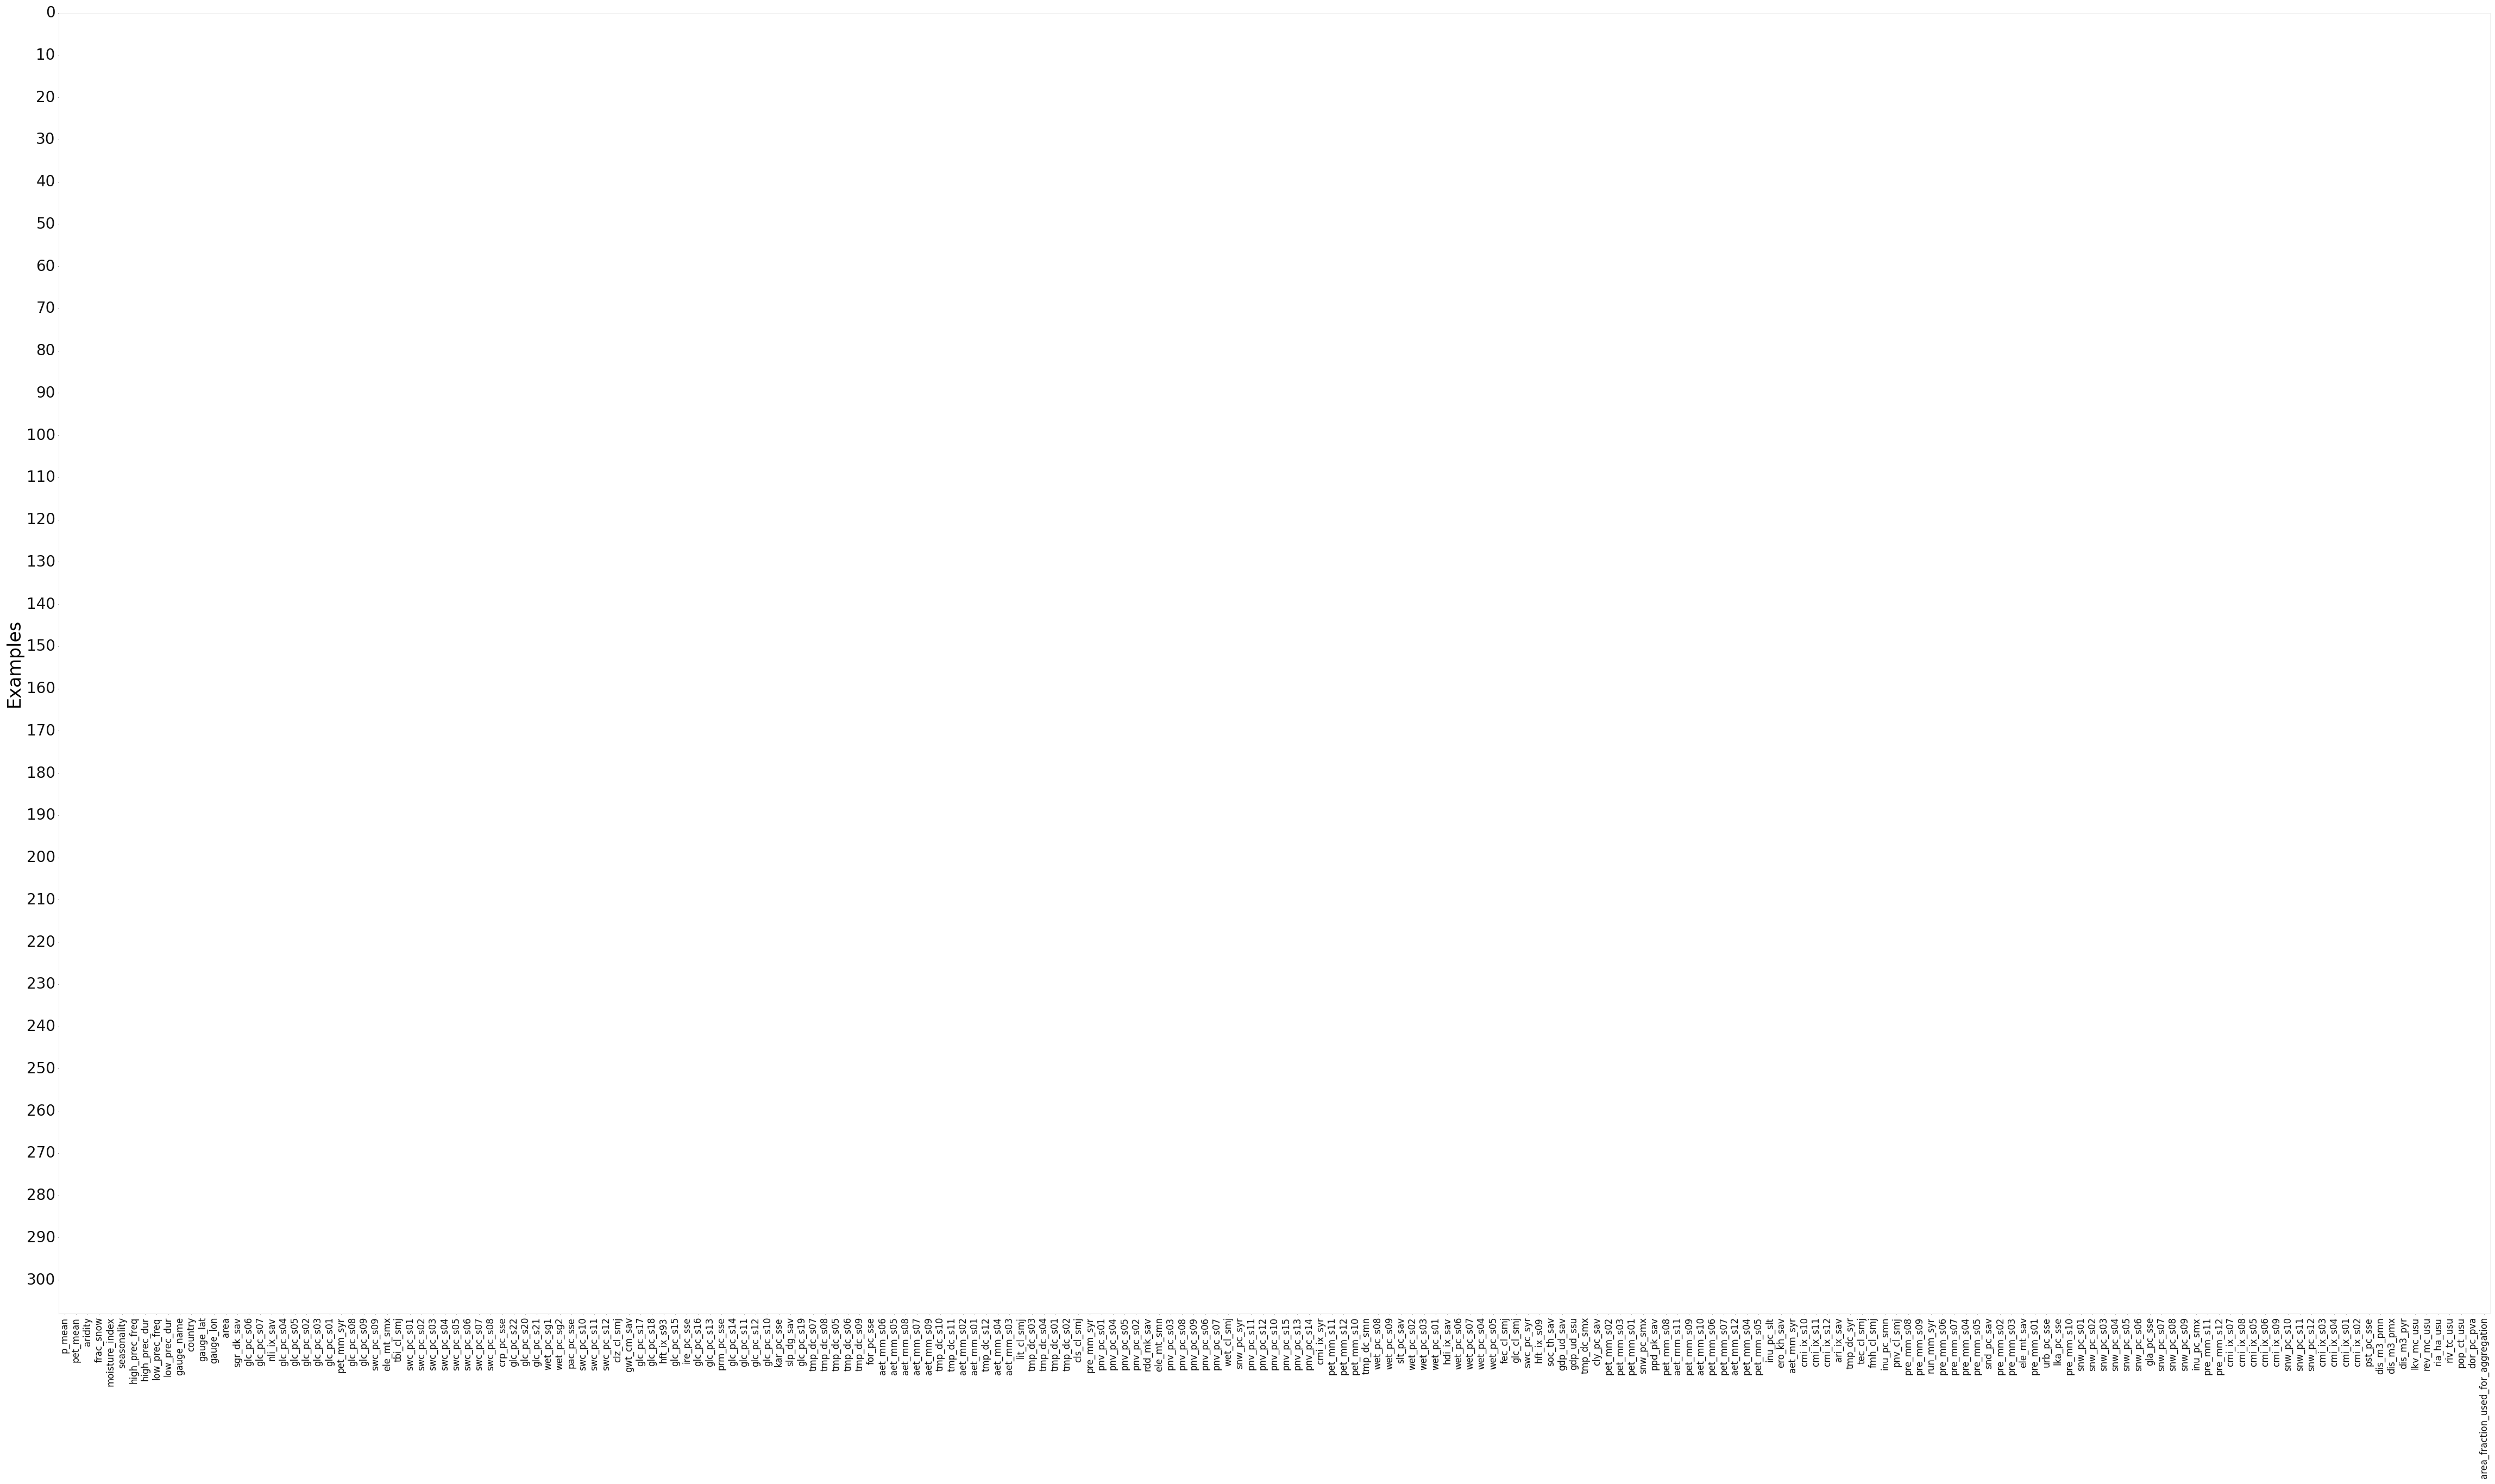
[14]:
static = static.dropna(axis=1)
static.shape
[14]:
(308, 211)
[15]:
physical_features = []
soil_features = []
geological_features = []
flow_characteristics = []
[15]:
lat = static['gauge_lat'].values.reshape(-1,)
long = static['gauge_lon'].values.reshape(-1,)
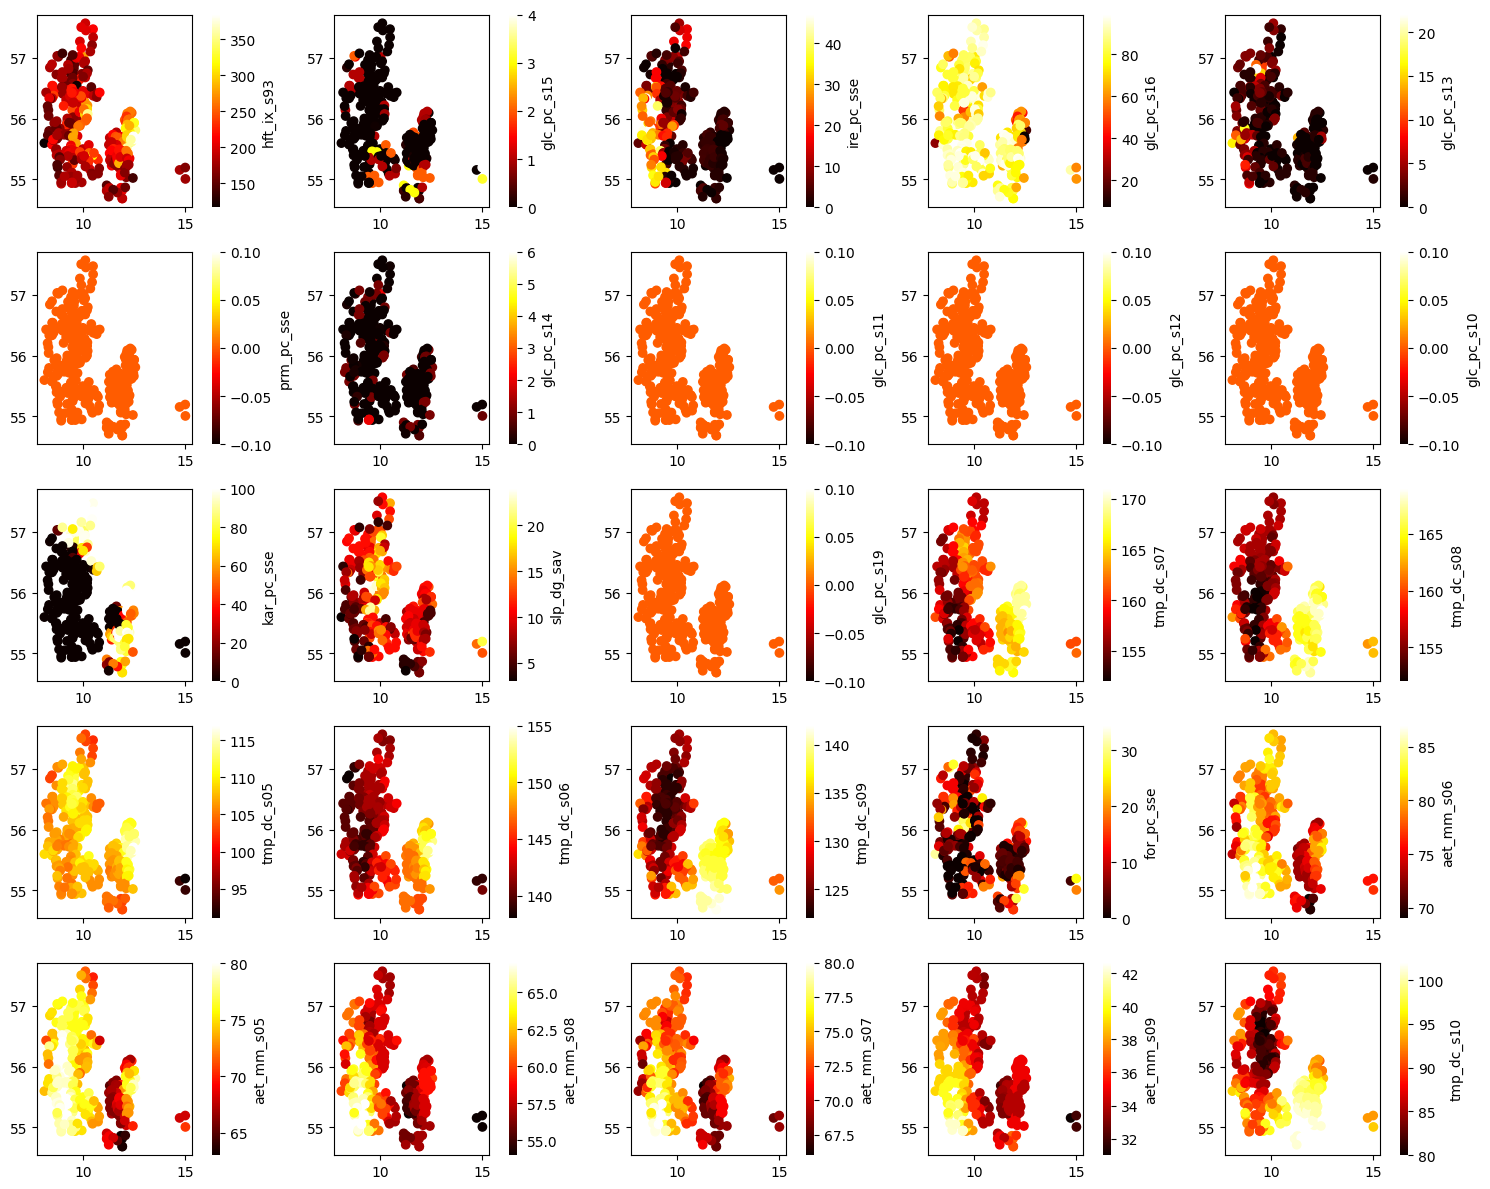
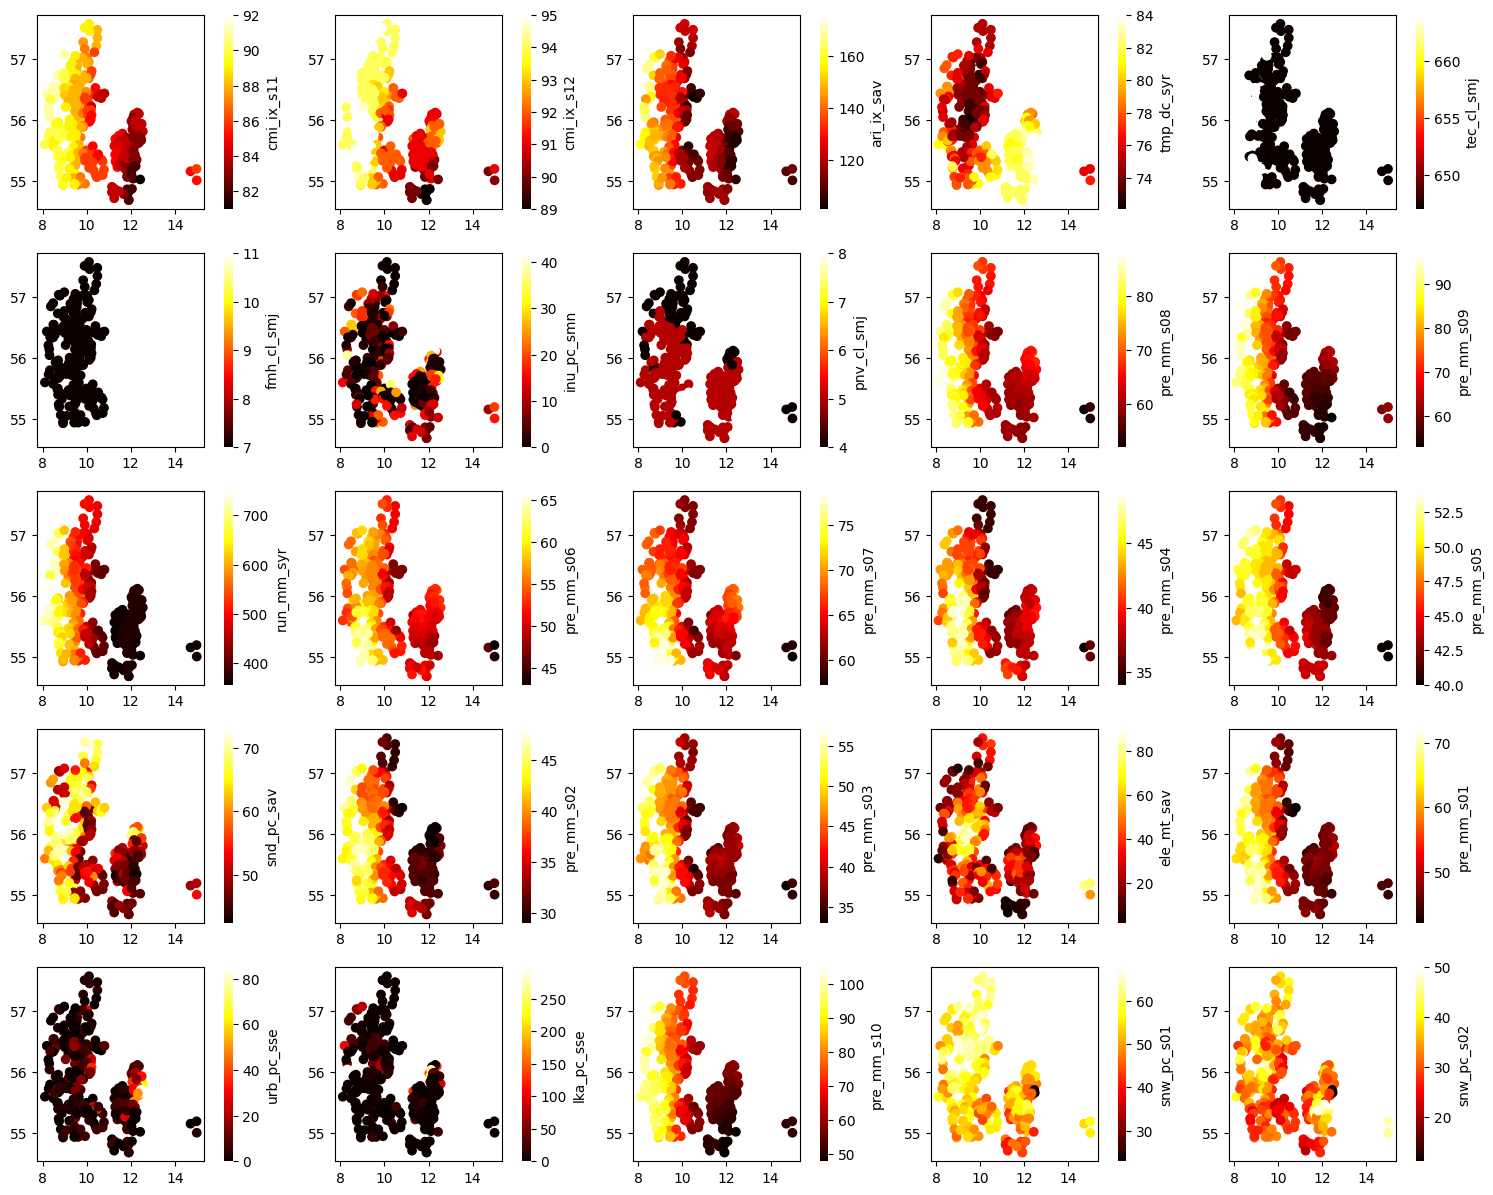
[17]:
idx = 0
ax_num = 0

fig, axes = plt.subplots(5, 5, figsize=(15, 12))
axes = axes.flatten()

while ax_num < 25 and idx<static.shape[1]:

    val = static.iloc[:, idx]
    idx += 1

    try:
        c = val.astype(float).values.reshape(-1,)

        en = static.shape[0]
        ax = axes[ax_num]
        ax, sc = scatter(long[0:en], lat[0:en], c=c[0:en], cmap="hot", show=False, ax=ax)

        process_cbar(ax, sc, border=False, title=val.name, #title_kws ={"fontsize": 14}
                    )
        ax_num += 1
    except ValueError:
        continue

plt.tight_layout()
plt.show()
print(idx)
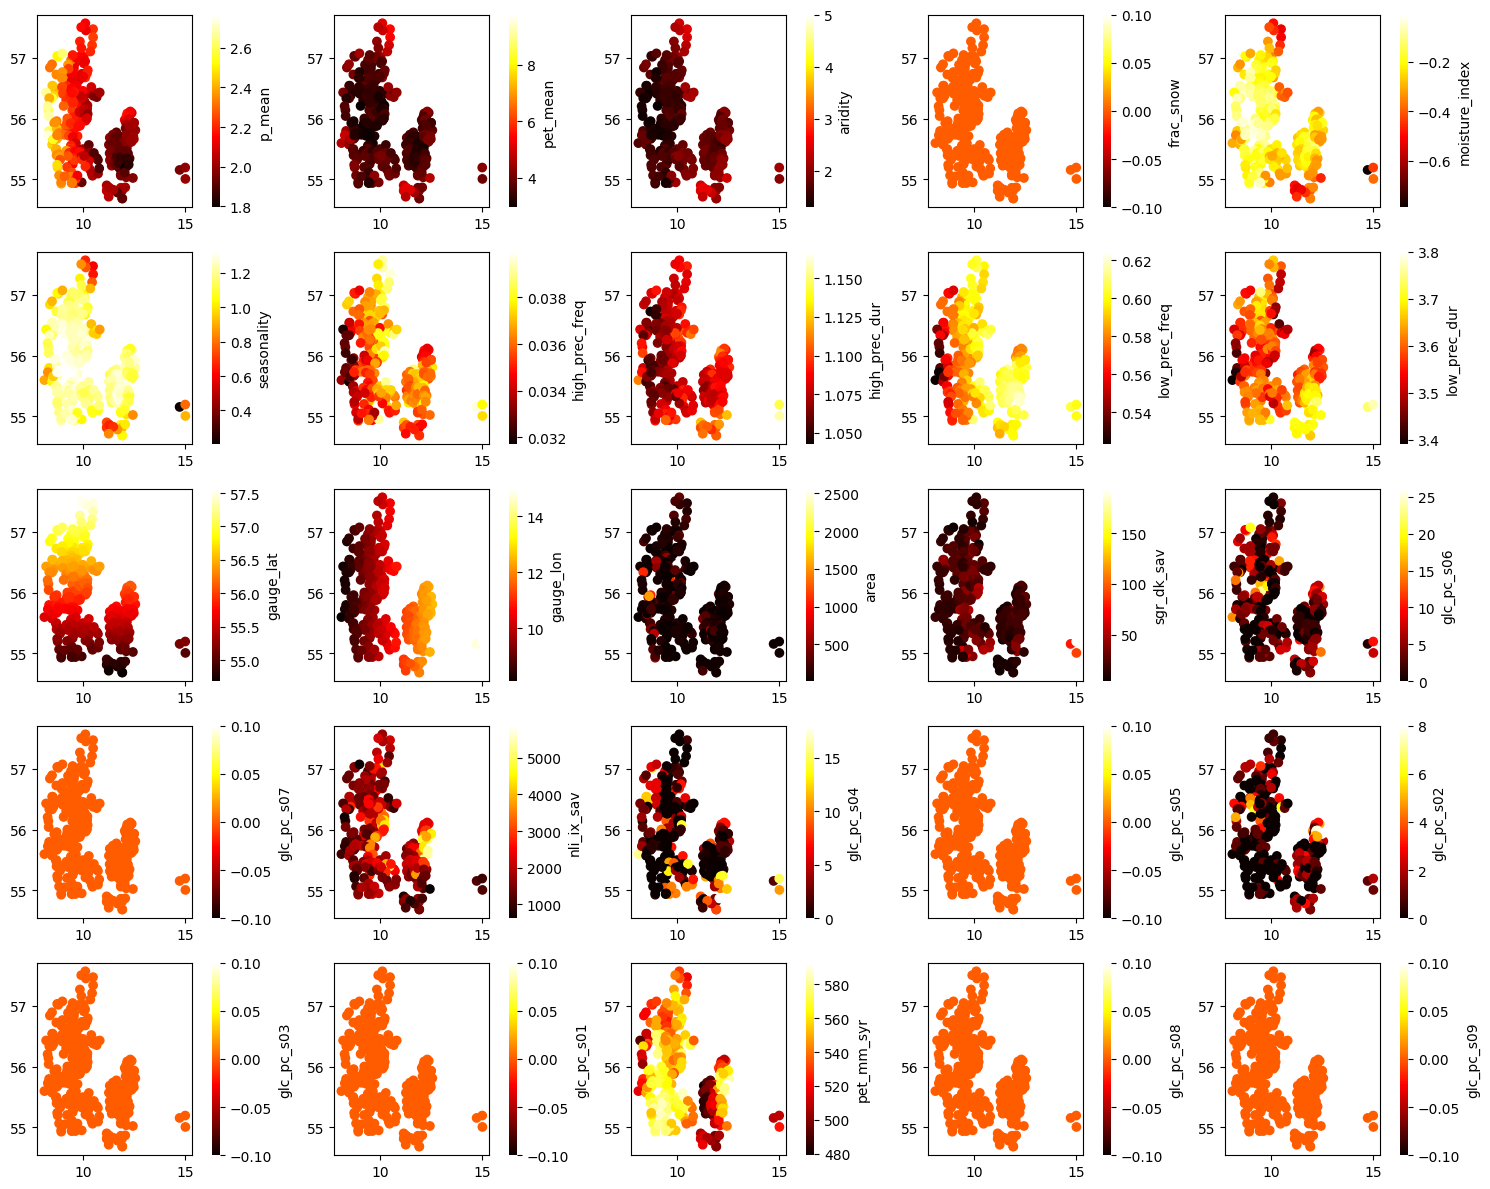
27
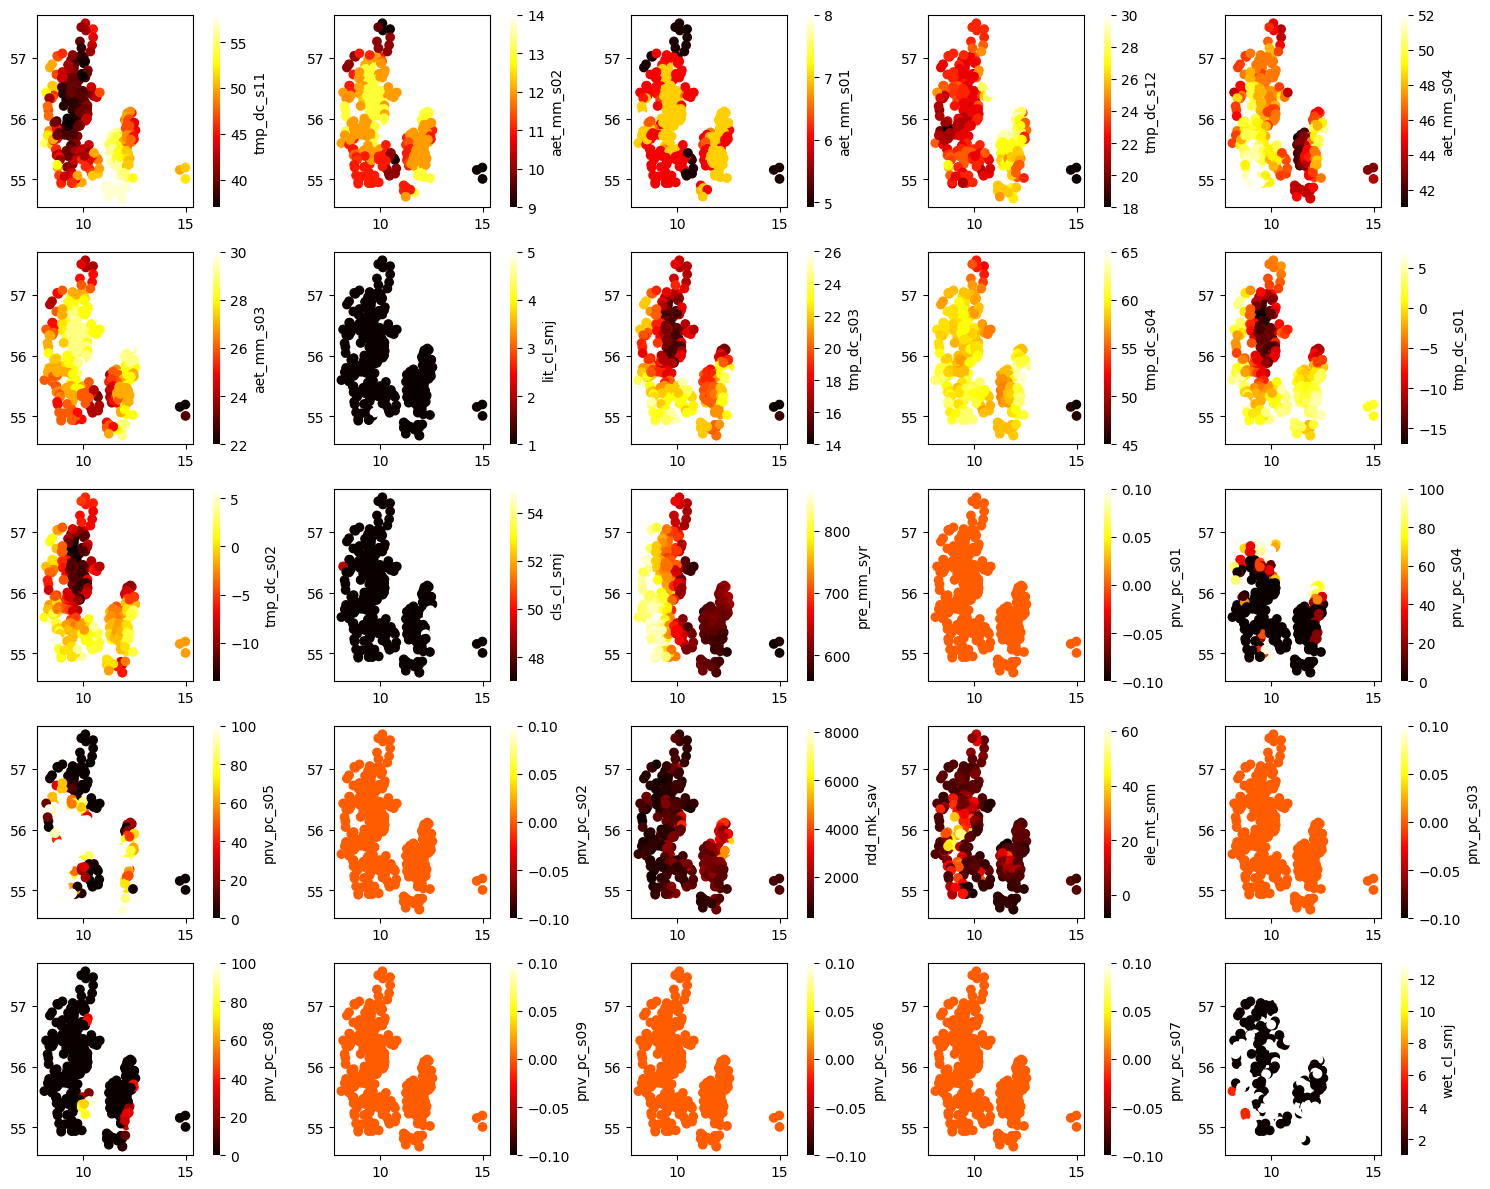
[18]:
idx = 27
ax_num = 0

fig, axes = plt.subplots(5, 5, figsize=(15, 12))
axes = axes.flatten()

while ax_num < 25 and idx<static.shape[1]:

    val = static.iloc[:, idx]
    idx += 1

    try:
        c = val.astype(float).values.reshape(-1,)

        en = static.shape[0]
        ax = axes[ax_num]
        ax, sc = scatter(long[0:en], lat[0:en], c=c[0:en], cmap="hot", show=False, ax=ax)

        process_cbar(ax, sc, border=False, title=val.name, #title_kws ={"fontsize": 14}
                    )
        ax_num += 1
    except ValueError:
        continue

plt.tight_layout()
plt.show()
print(idx)
52
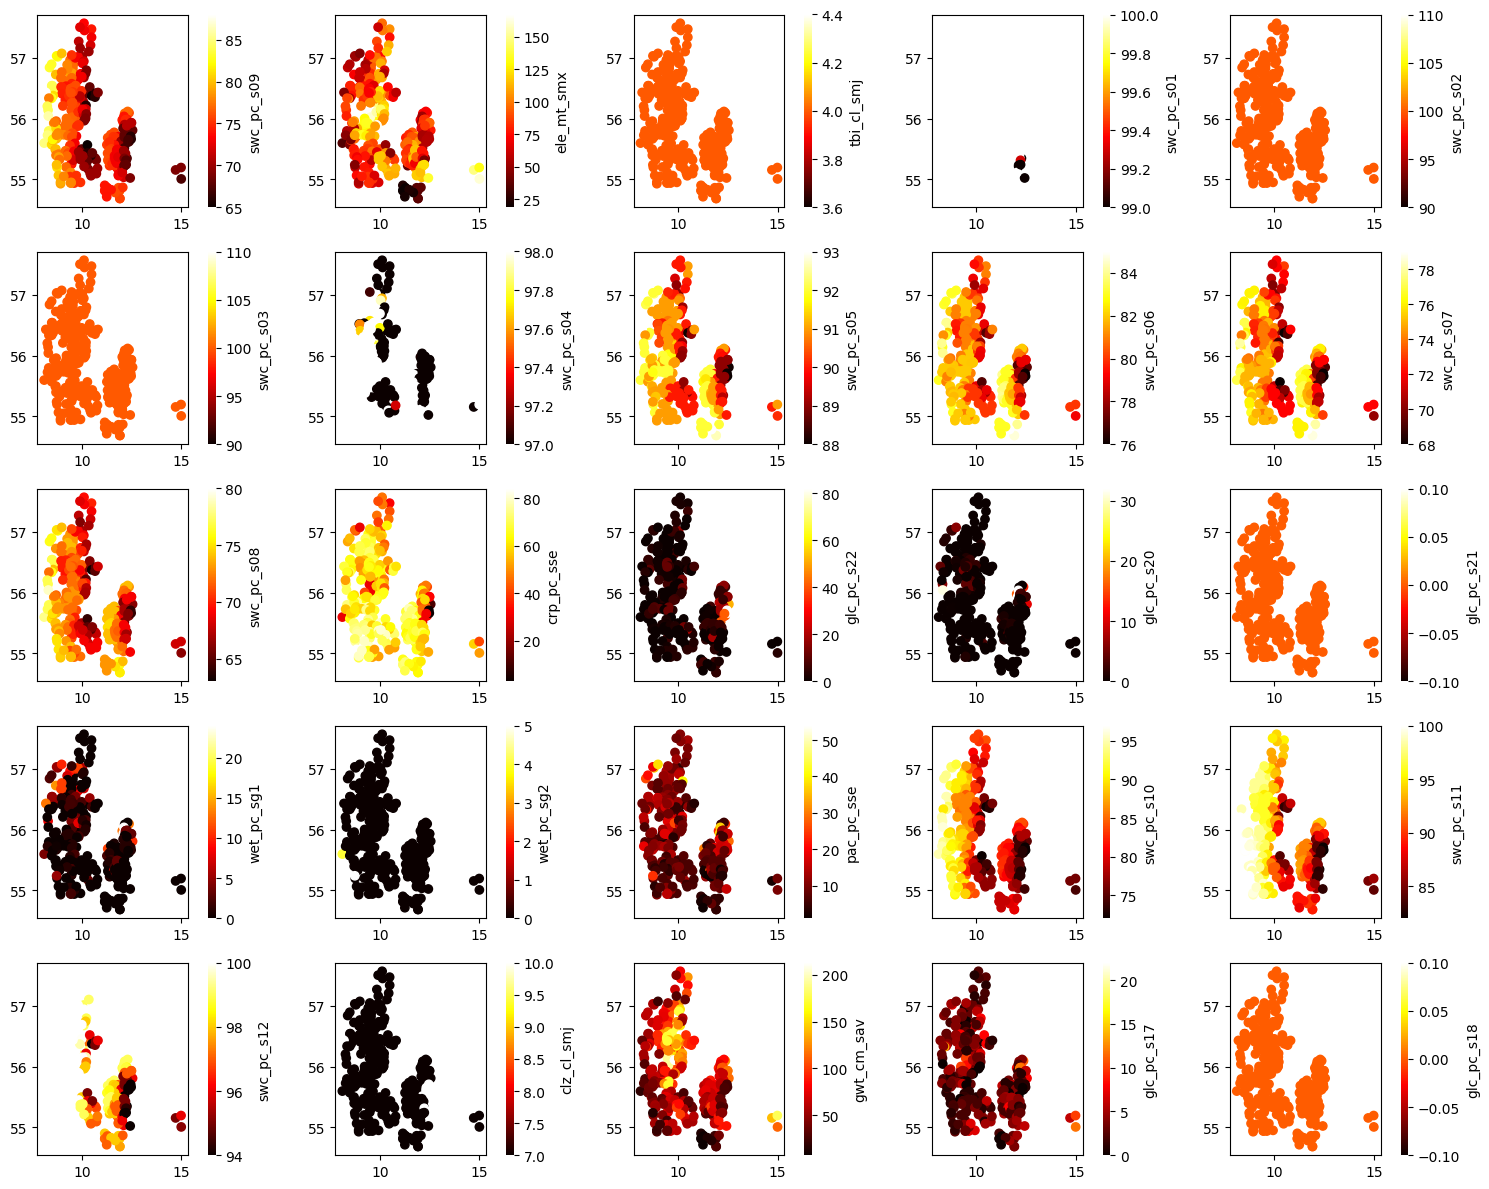
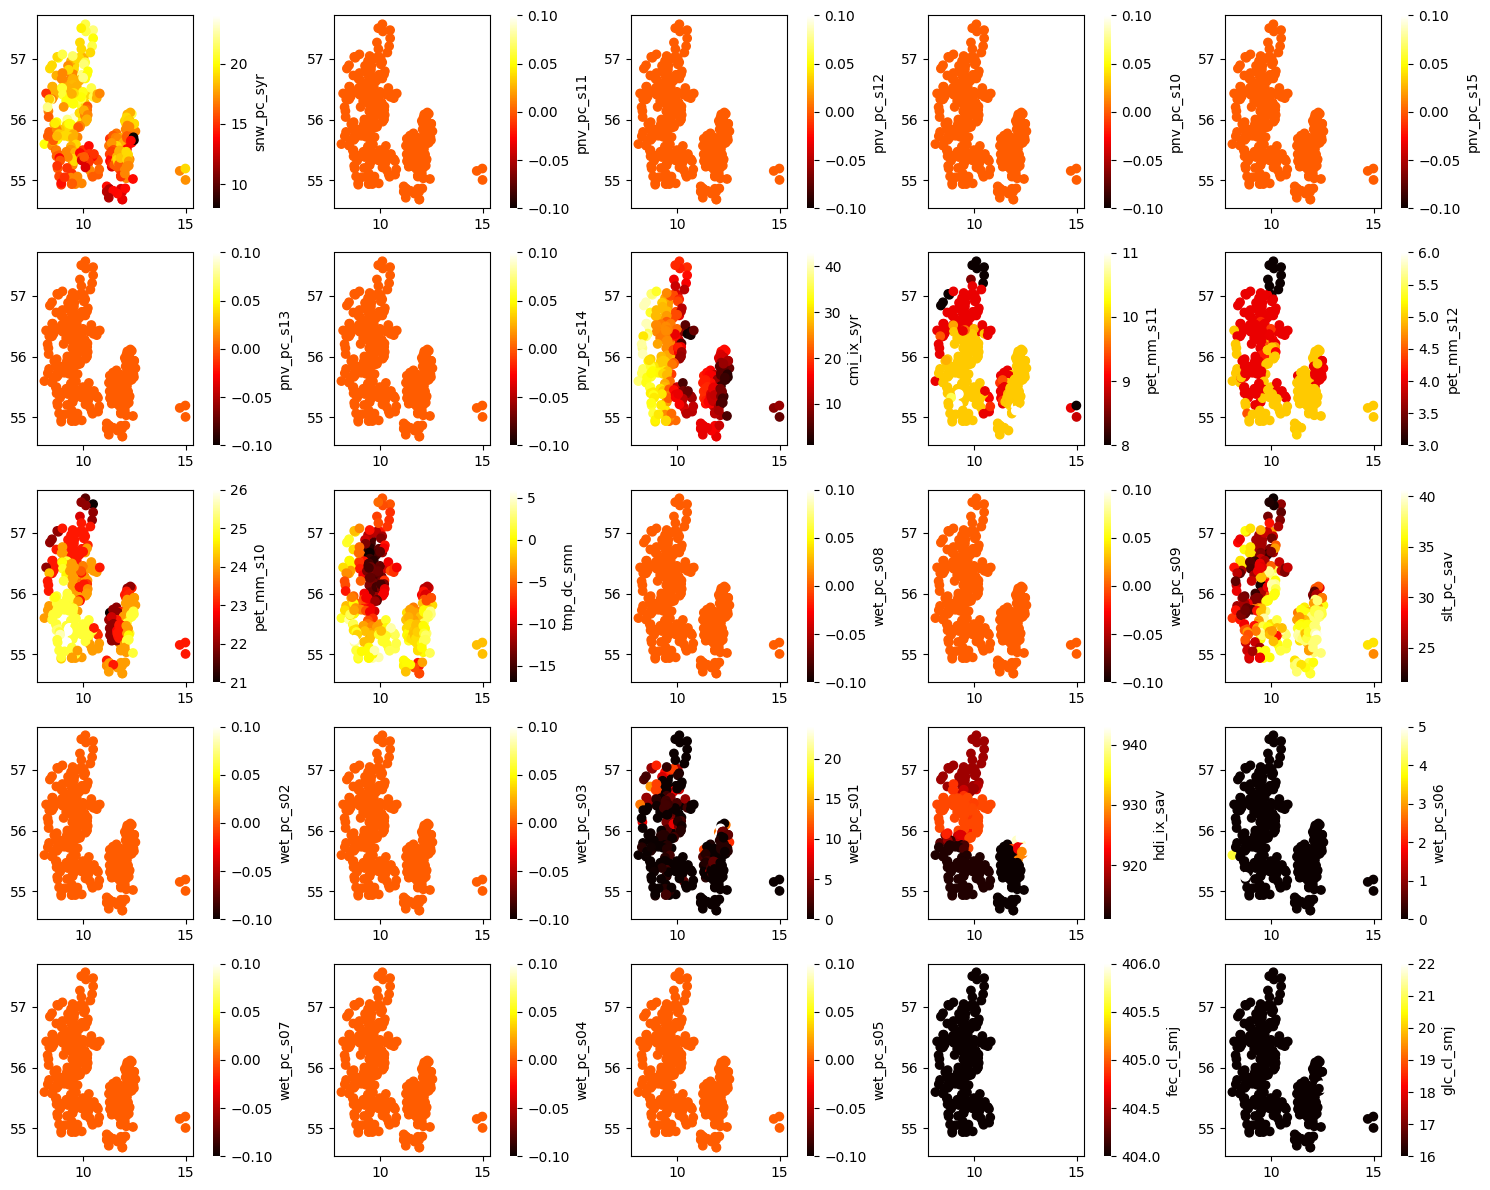
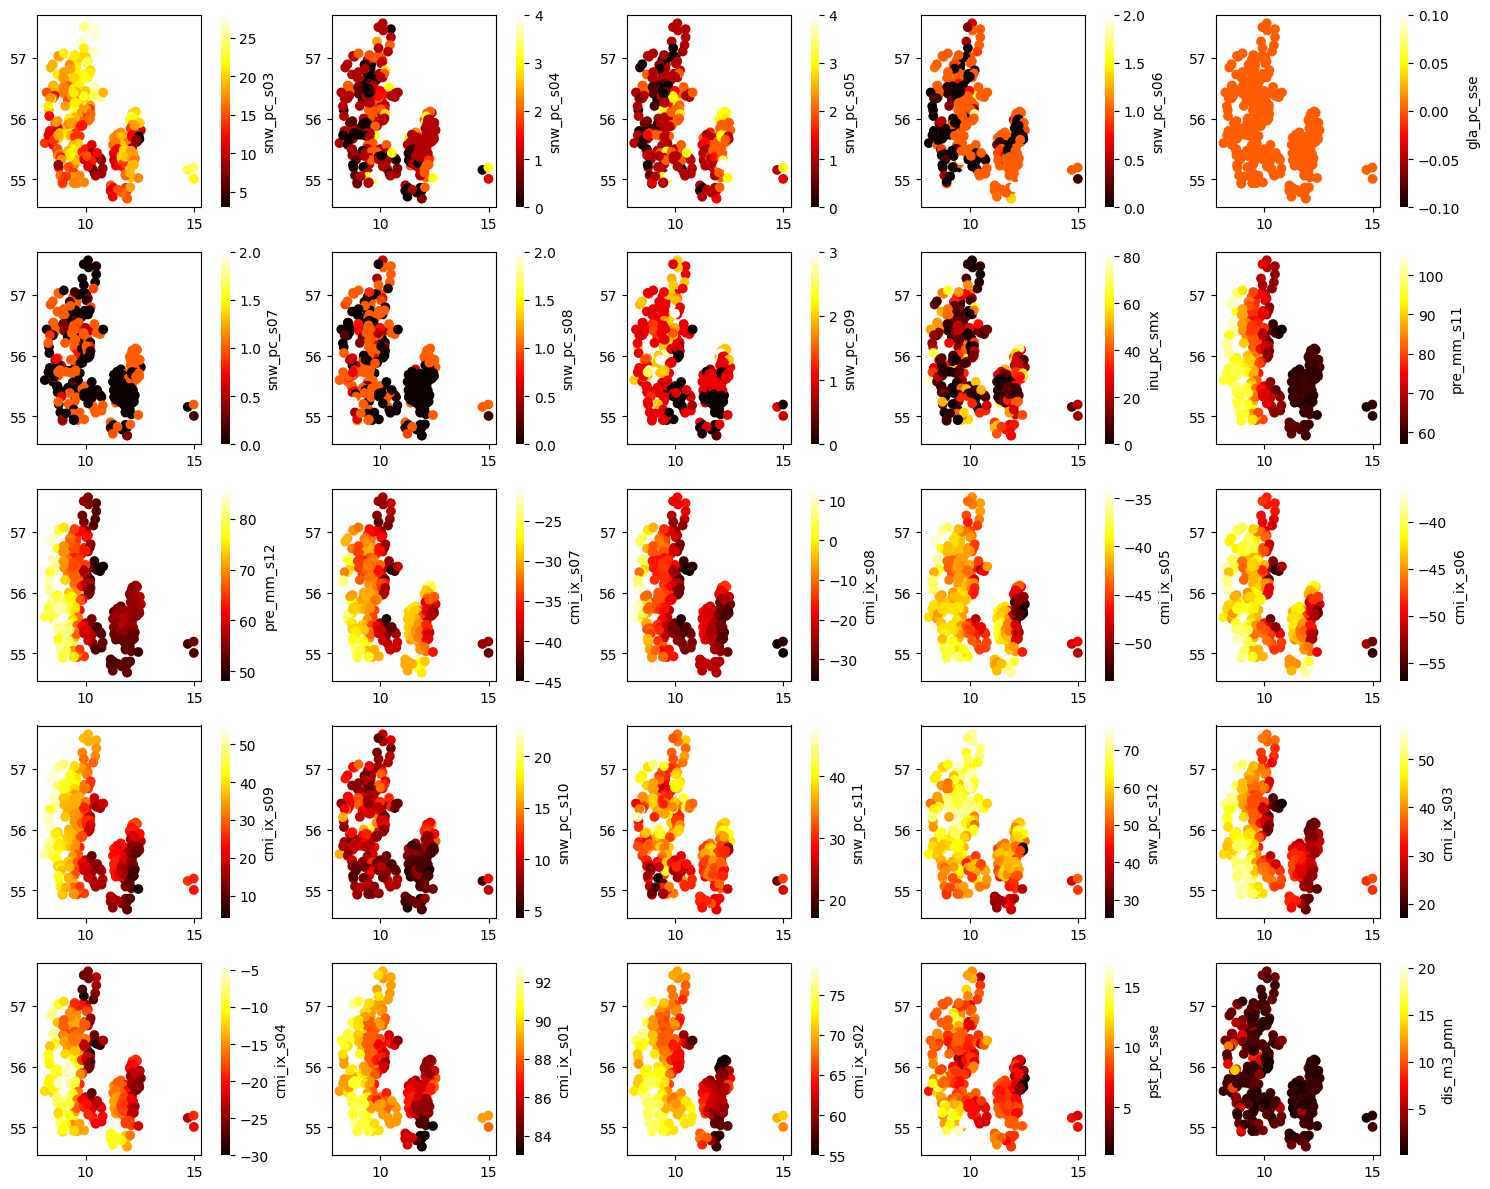
[19]:
idx = 52
ax_num = 0

fig, axes = plt.subplots(5, 5, figsize=(15, 12))
axes = axes.flatten()

while ax_num < 25 and idx<static.shape[1]:

    val = static.iloc[:, idx]
    idx += 1

    try:
        c = val.astype(float).values.reshape(-1,)

        en = static.shape[0]
        ax = axes[ax_num]
        ax, sc = scatter(long[0:en], lat[0:en], c=c[0:en], cmap="hot", show=False, ax=ax)

        process_cbar(ax, sc, border=False, title=val.name, #title_kws ={"fontsize": 14}
                    )
        ax_num += 1
    except ValueError:
        continue

plt.tight_layout()
plt.show()
print(idx)
77
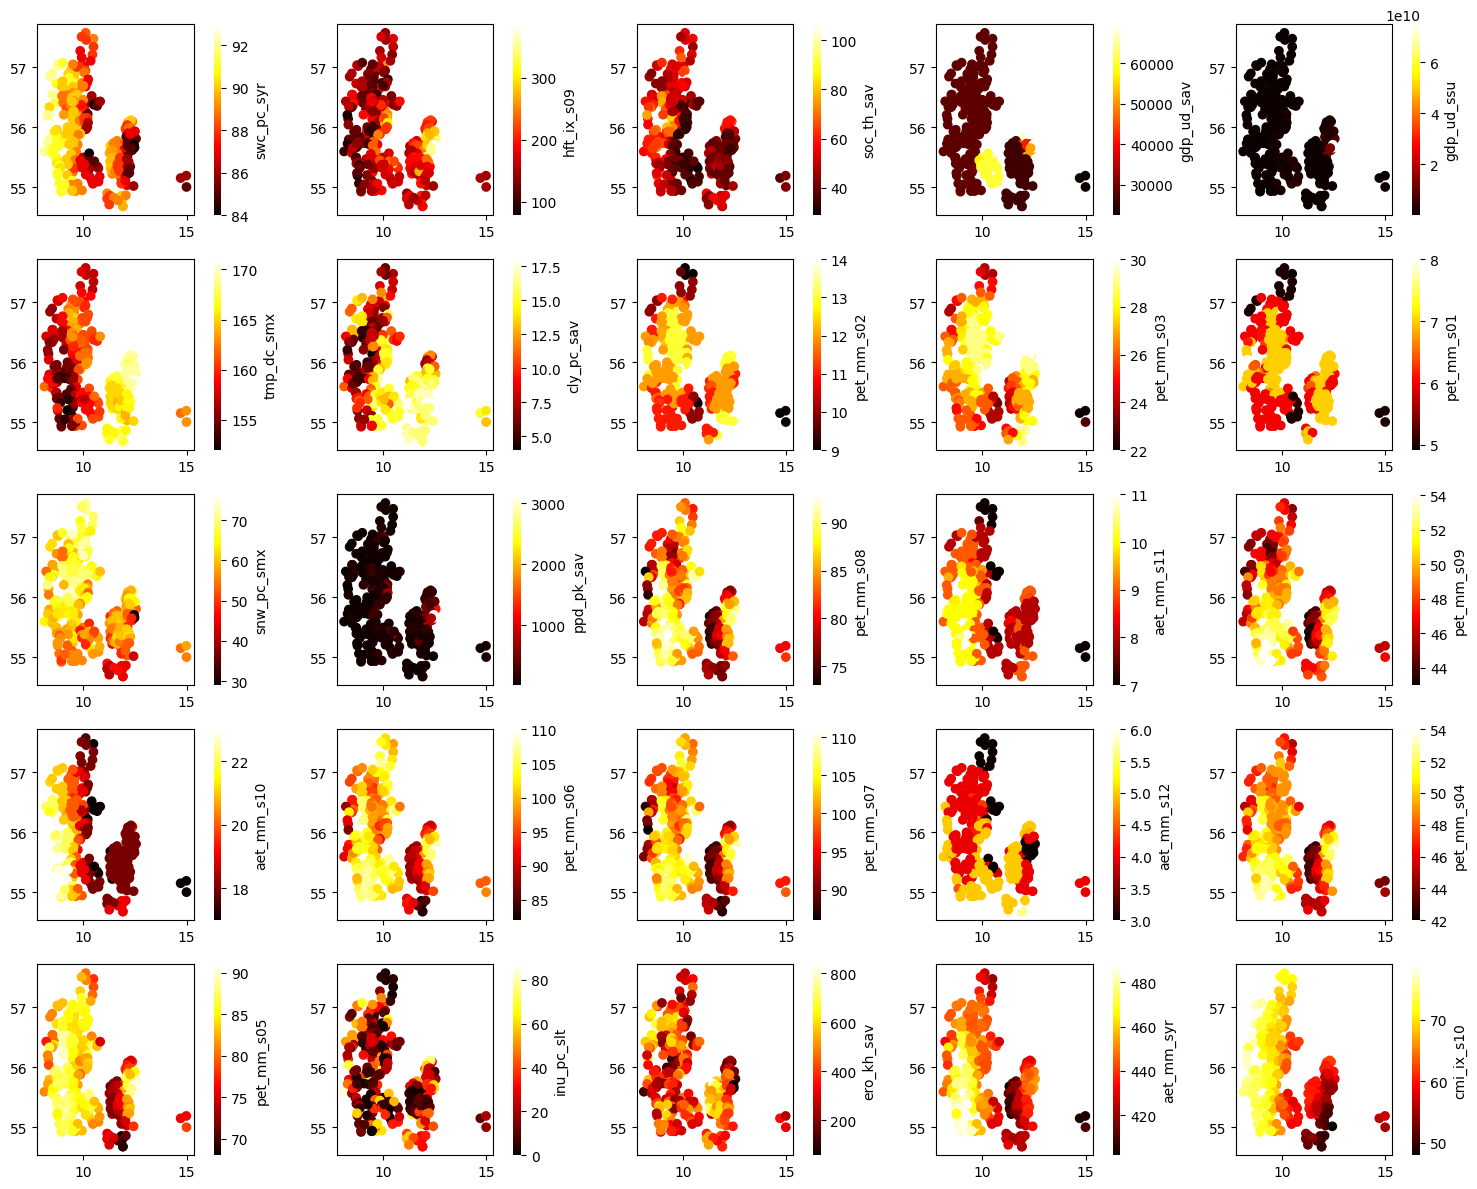
[20]:
idx = 77
ax_num = 0

fig, axes = plt.subplots(5, 5, figsize=(15, 12))
axes = axes.flatten()

while ax_num < 25 and idx<static.shape[1]:

    val = static.iloc[:, idx]
    idx += 1

    try:
        c = val.astype(float).values.reshape(-1,)

        en = static.shape[0]
        ax = axes[ax_num]
        ax, sc = scatter(long[0:en], lat[0:en], c=c[0:en], cmap="hot", show=False, ax=ax)

        process_cbar(ax, sc, border=False, title=val.name, #title_kws ={"fontsize": 14}
                    )
        ax_num += 1
    except ValueError:
        continue

plt.tight_layout()
plt.show()
print(idx)
102
[21]:
idx = 102
ax_num = 0

fig, axes = plt.subplots(5, 5, figsize=(15, 12))
axes = axes.flatten()

while ax_num < 25 and idx<static.shape[1]:

    val = static.iloc[:, idx]
    idx += 1

    try:
        c = val.astype(float).values.reshape(-1,)

        en = static.shape[0]
        ax = axes[ax_num]
        ax, sc = scatter(long[0:en], lat[0:en], c=c[0:en], cmap="hot", show=False, ax=ax)

        process_cbar(ax, sc, border=False, title=val.name, #title_kws ={"fontsize": 14}
                    )
        ax_num += 1
    except ValueError:
        continue

plt.tight_layout()
plt.show()
print(idx)
127
[22]:
idx = 127
ax_num = 0

fig, axes = plt.subplots(5, 5, figsize=(15, 12))
axes = axes.flatten()

while ax_num < 25 and idx<static.shape[1]:

    val = static.iloc[:, idx]
    idx += 1

    try:
        c = val.astype(float).values.reshape(-1,)

        en = static.shape[0]
        ax = axes[ax_num]
        ax, sc = scatter(long[0:en], lat[0:en], c=c[0:en], cmap="hot", show=False, ax=ax)

        process_cbar(ax, sc, border=False, title=val.name, #title_kws ={"fontsize": 14}
                    )
        ax_num += 1
    except ValueError:
        continue

plt.tight_layout()
plt.show()
print(idx)
152
[23]:
idx = 152
ax_num = 0

fig, axes = plt.subplots(5, 5, figsize=(15, 12))
axes = axes.flatten()

while ax_num < 25 and idx<static.shape[1]:

    val = static.iloc[:, idx]
    idx += 1

    try:
        c = val.astype(float).values.reshape(-1,)

        en = static.shape[0]
        ax = axes[ax_num]
        ax, sc = scatter(long[0:en], lat[0:en], c=c[0:en], cmap="hot", show=False, ax=ax)

        process_cbar(ax, sc, border=False, title=val.name, #title_kws ={"fontsize": 14}
                    )
        ax_num += 1
    except ValueError:
        continue

plt.tight_layout()
plt.show()
print(idx)
177
[24]:
idx = 177
ax_num = 0

fig, axes = plt.subplots(5, 5, figsize=(15, 12))
axes = axes.flatten()

while ax_num < 25 and idx<static.shape[1]:

    val = static.iloc[:, idx]
    idx += 1

    try:
        c = val.astype(float).values.reshape(-1,)

        en = static.shape[0]
        ax = axes[ax_num]
        ax, sc = scatter(long[0:en], lat[0:en], c=c[0:en], cmap="hot", show=False, ax=ax)

        process_cbar(ax, sc, border=False, title=val.name, #title_kws ={"fontsize": 14}
                    )
        ax_num += 1
    except ValueError:
        print(f"{val.name} is not converted to numeric")
        continue

plt.tight_layout()
plt.show()
print(idx)
202
[25]:
idx = 202
ax_num = 0

fig, axes = plt.subplots(5, 5, figsize=(15, 12))
axes = axes.flatten()

while ax_num < 25 and idx<static.shape[1]:

    val = static.iloc[:, idx]
    idx += 1

    try:
        c = val.astype(float).values.reshape(-1,)

        en = static.shape[0]
        ax = axes[ax_num]
        ax, sc = scatter(long[0:en], lat[0:en], c=c[0:en], cmap="hot", show=False, ax=ax)

        process_cbar(ax, sc, border=False, title=val.name, #title_kws ={"fontsize": 14}
                    )
        ax_num += 1
    except ValueError:
        print(f"{val.name} is not converted to numeric")
        continue

plt.tight_layout()
plt.show()
print(idx)
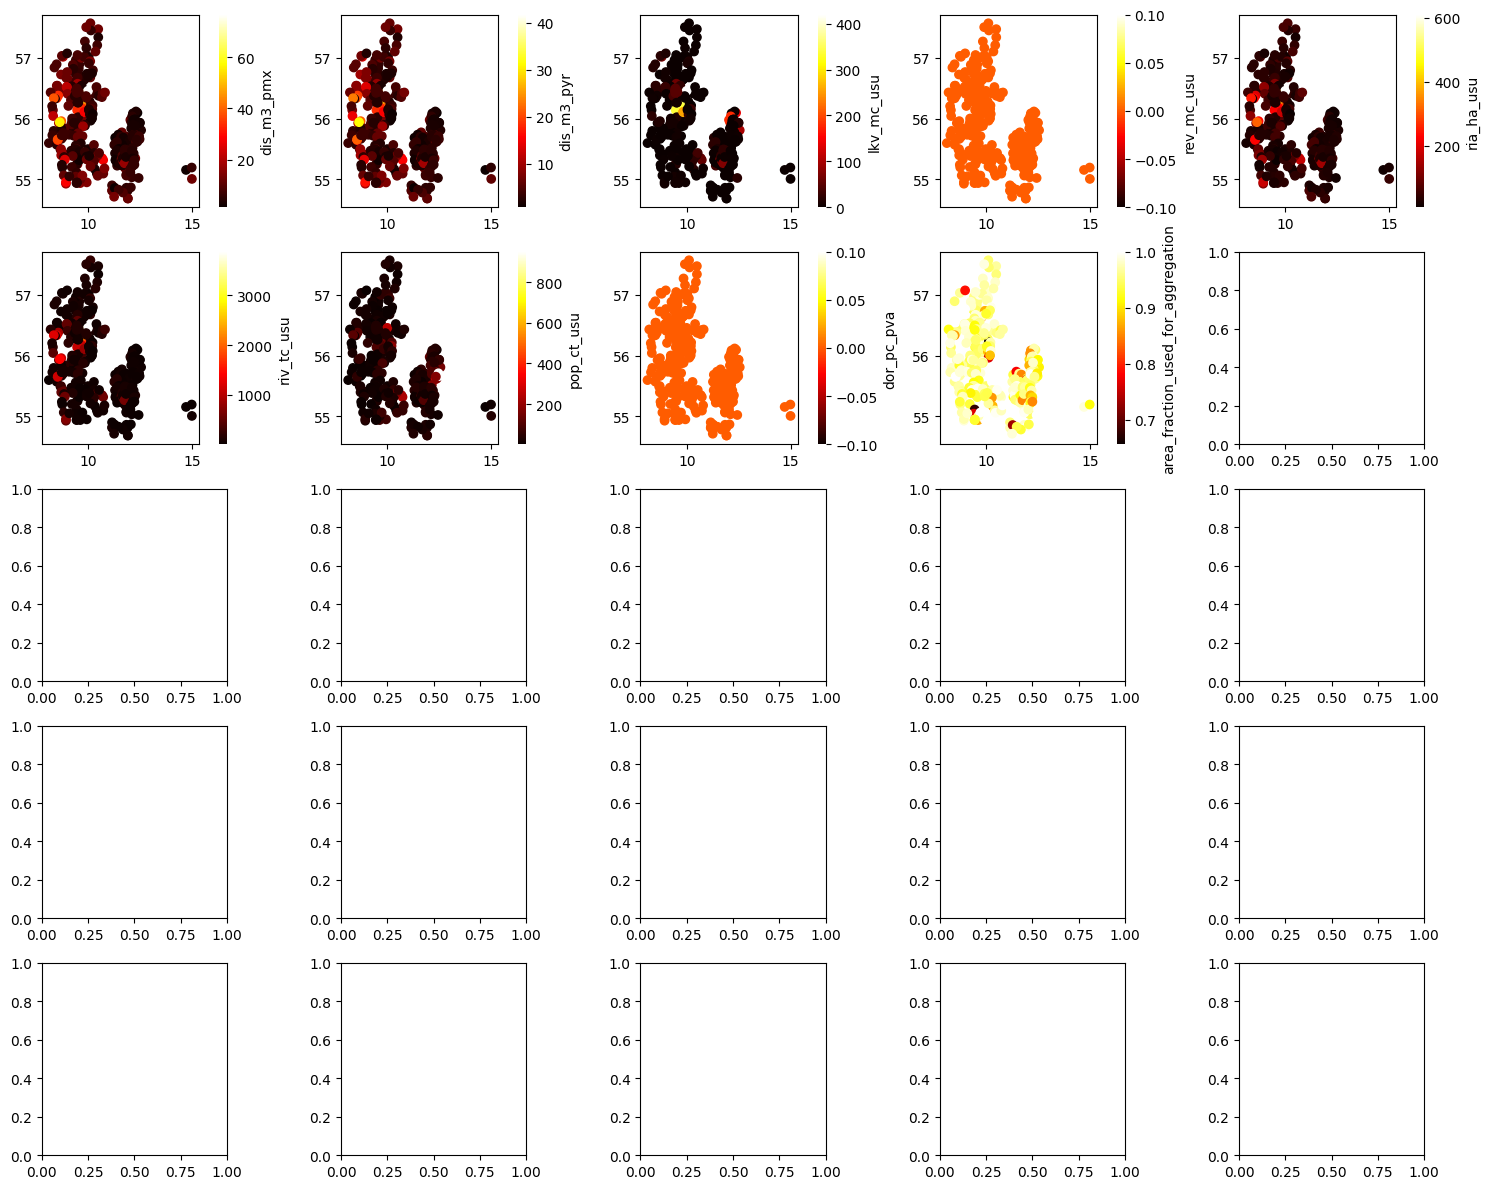
211
Dynamic Features
[26]:
dataset.dynamic_features
[26]:
['snow_depth_water_equivalent_mean',
 'surface_net_solar_radiation_mean',
 'surface_net_thermal_radiation_mean',
 'surface_pressure_mean',
 'temperature_2m_mean',
 'dewpoint_temperature_2m_mean',
 'u_component_of_wind_10m_mean',
 'v_component_of_wind_10m_mean',
 'volumetric_soil_water_layer_1_mean',
 'volumetric_soil_water_layer_2_mean',
 'volumetric_soil_water_layer_3_mean',
 'volumetric_soil_water_layer_4_mean',
 'snow_depth_water_equivalent_min',
 'surface_net_solar_radiation_min',
 'surface_net_thermal_radiation_min',
 'surface_pressure_min',
 'temperature_2m_min',
 'dewpoint_temperature_2m_min',
 'u_component_of_wind_10m_min',
 'v_component_of_wind_10m_min',
 'volumetric_soil_water_layer_1_min',
 'volumetric_soil_water_layer_2_min',
 'volumetric_soil_water_layer_3_min',
 'volumetric_soil_water_layer_4_min',
 'snow_depth_water_equivalent_max',
 'surface_net_solar_radiation_max',
 'surface_net_thermal_radiation_max',
 'surface_pressure_max',
 'temperature_2m_max',
 'dewpoint_temperature_2m_max',
 'u_component_of_wind_10m_max',
 'v_component_of_wind_10m_max',
 'volumetric_soil_water_layer_1_max',
 'volumetric_soil_water_layer_2_max',
 'volumetric_soil_water_layer_3_max',
 'volumetric_soil_water_layer_4_max',
 'total_precipitation_sum',
 'potential_evaporation_sum',
 'streamflow']
[27]:
# what is u and v component ???
# unit of streamflow ???
# what is sum in potential evapotranspiration ???
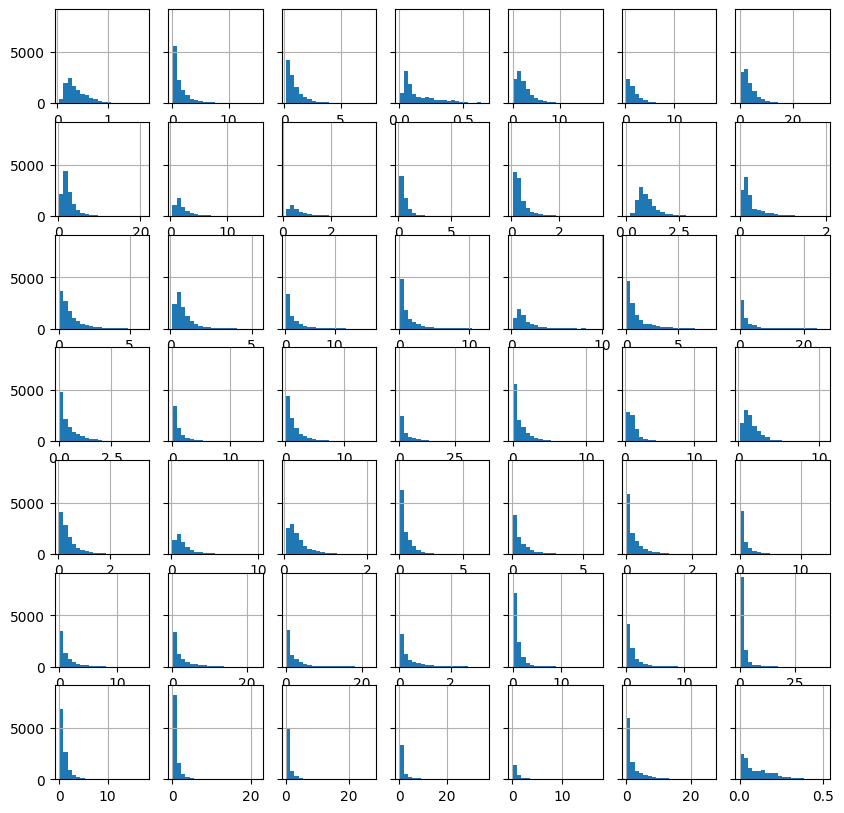
Streamflow
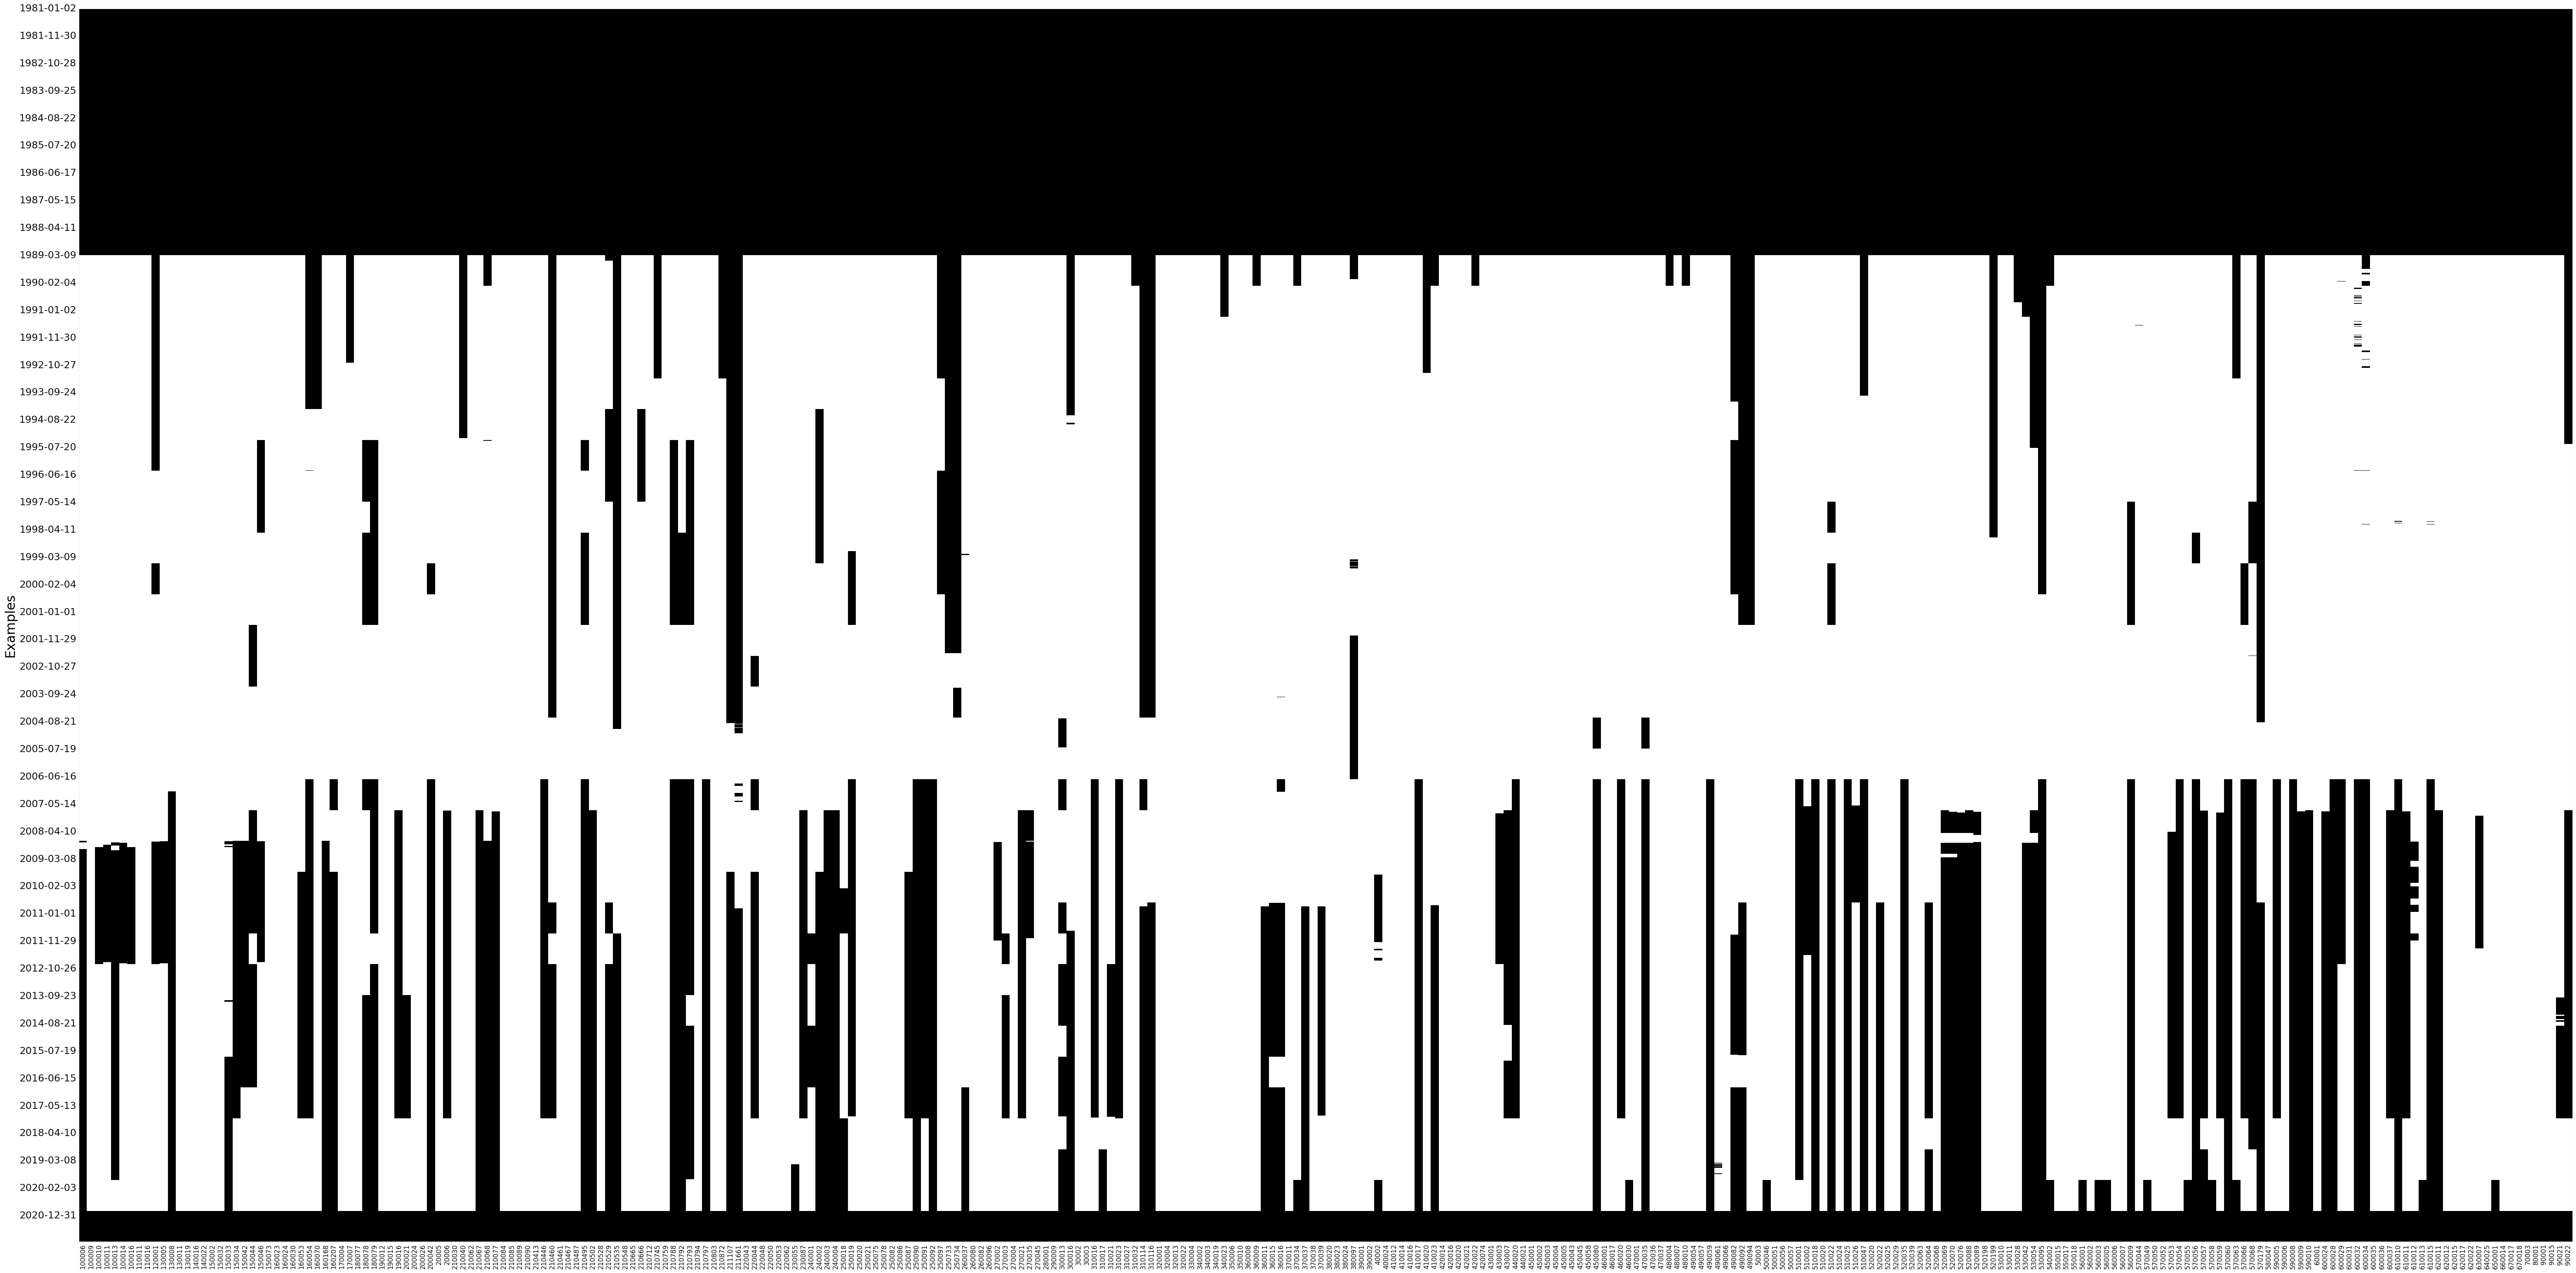
[28]:
streamflow = dataset.q_mmd()
print(streamflow.shape)
(14609, 308)
[29]:
_ = EDA(data=streamflow, save=False).heatmap()
[30]:
st = 0

fig, axes = plt.subplots(7, 7, figsize=(10, 10), sharey="all")

idx = st
for _, ax in enumerate(axes.flat):

    hist(streamflow.iloc[:, idx].values.reshape(-1,),
         bins=20,
         ax=ax,
         show=False
        )

    idx += 1

plt.show()
print(idx)
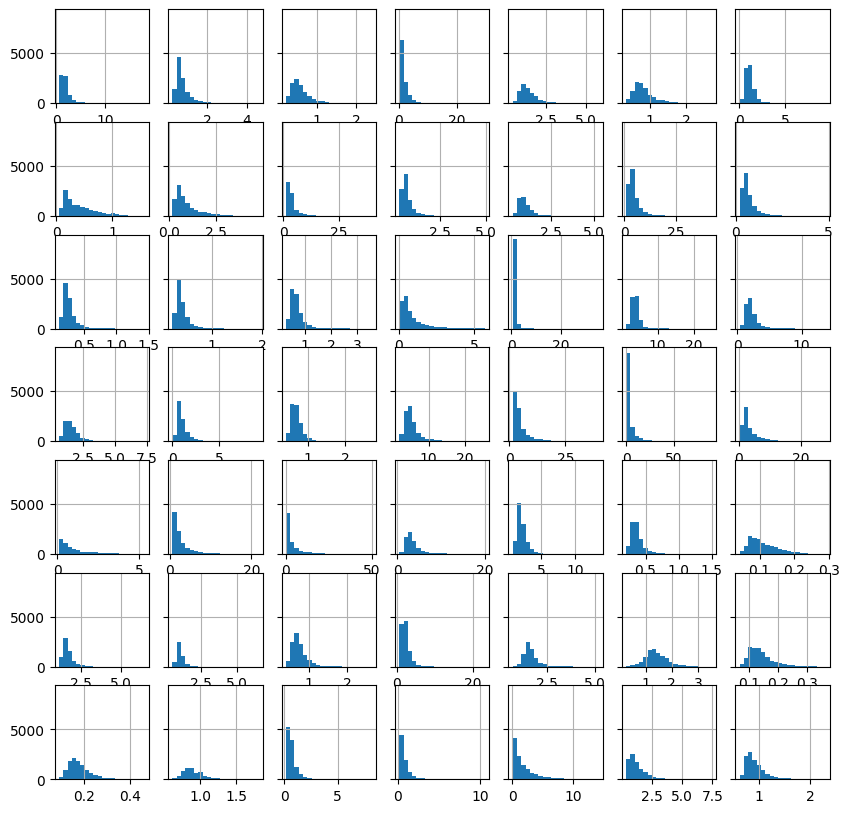
49
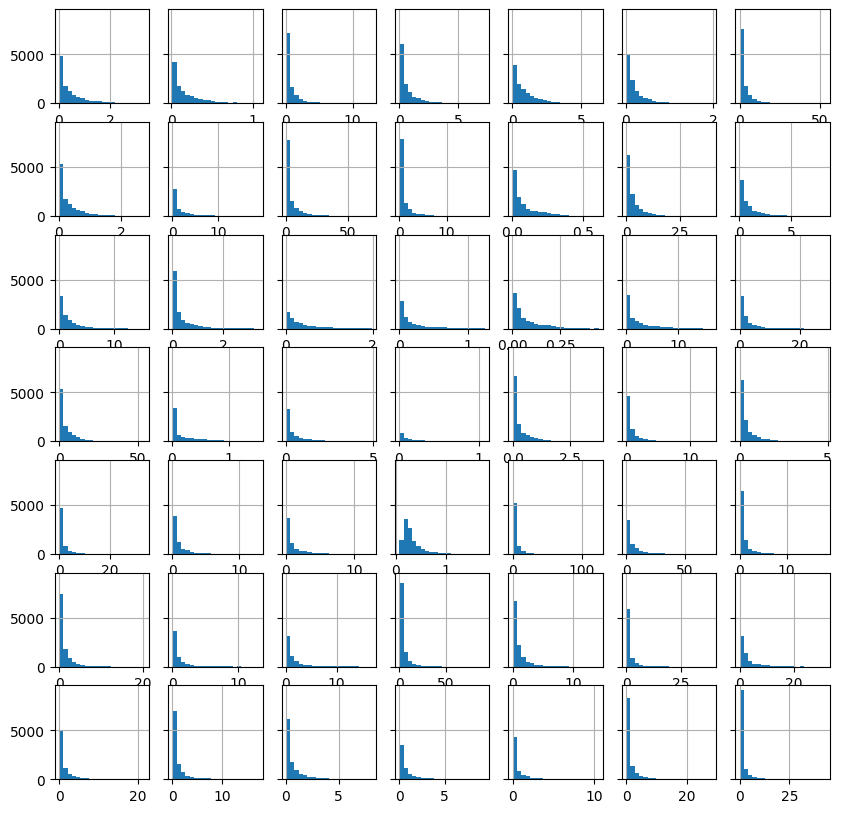
[31]:
st = 49

fig, axes = plt.subplots(7, 7, figsize=(10, 10), sharey="all")

idx = st
for _, ax in enumerate(axes.flat):

    hist(streamflow.iloc[:, idx].values.reshape(-1,),
         bins=20,
         ax=ax,
         show=False
        )

    idx += 1

plt.show()
print(idx)
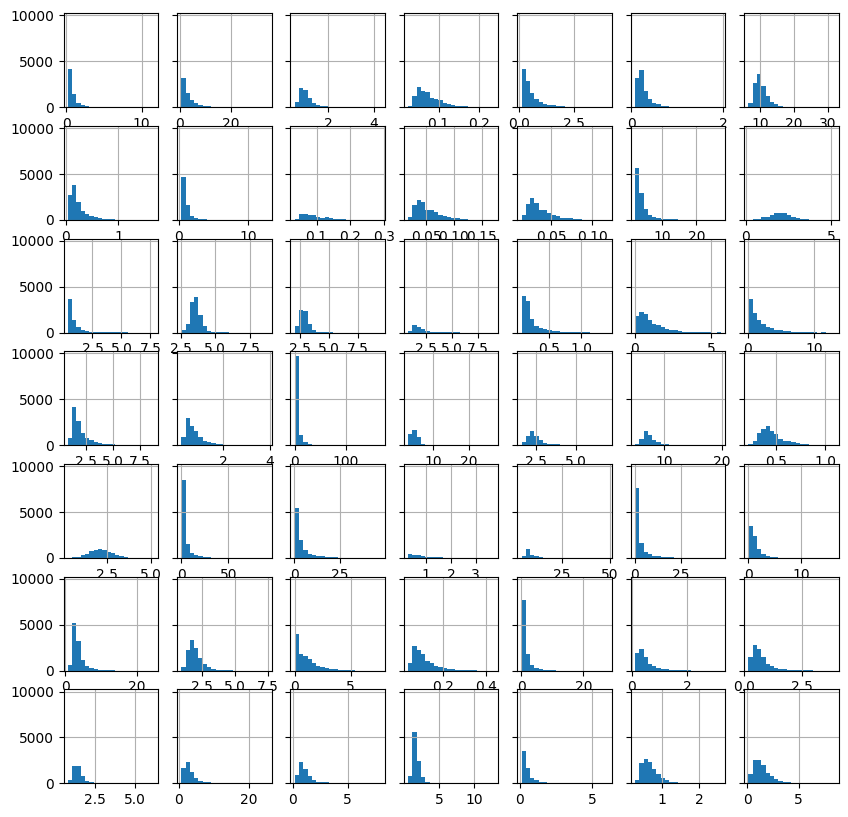
98
[32]:
st = 98

fig, axes = plt.subplots(7, 7, figsize=(10, 10), sharey="all")

idx = st
for _, ax in enumerate(axes.flat):

    hist(streamflow.iloc[:, idx].values.reshape(-1,),
         bins=20,
         ax=ax,
         show=False
        )

    idx += 1

plt.show()
print(idx)
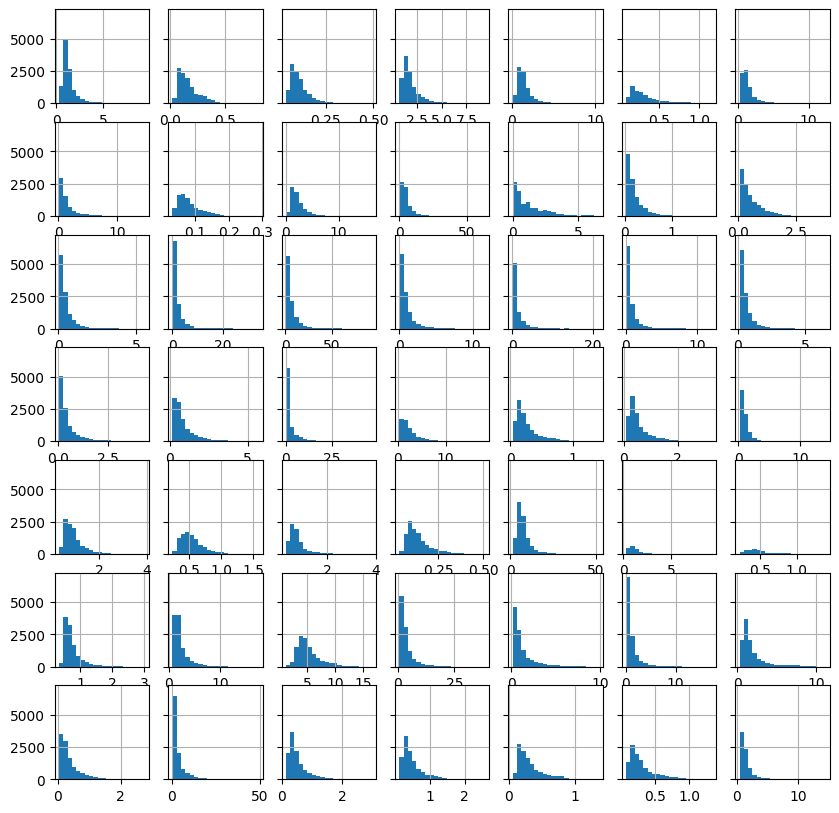
147
[33]:
st = 147

fig, axes = plt.subplots(7, 7, figsize=(10, 10), sharey="all")

idx = st
for _, ax in enumerate(axes.flat):

    hist(streamflow.iloc[:, idx].values.reshape(-1,),
         bins=20,
         ax=ax,
         show=False
        )

    idx += 1

plt.show()
print(idx)
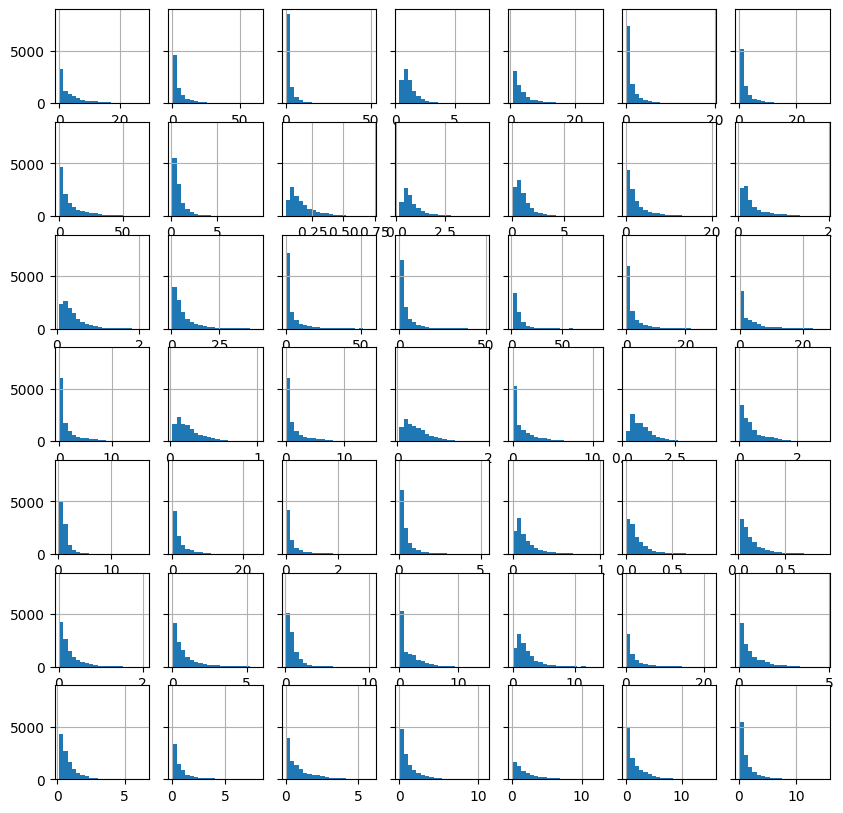
196
[34]:
st = 196

fig, axes = plt.subplots(7, 7, figsize=(10, 10), sharey="all")

idx = st
for _, ax in enumerate(axes.flat):


    hist(streamflow.iloc[:, idx].values.reshape(-1,),
     bins=20,
     ax=ax,
     show=False
    )

    idx += 1

plt.show()
print(idx)
245
[35]:
st = 245

fig, axes = plt.subplots(7, 7, figsize=(10, 10), sharey="all")

idx = st
for _, ax in enumerate(axes.flat):


    hist(streamflow.iloc[:, idx].values.reshape(-1,),
     bins=20,
     ax=ax,
     show=False
    )

    idx += 1

plt.show()
print(idx)
294
[36]:
st = 294

fig, axes = plt.subplots(4, 4, figsize=(10, 10), sharey="all")

idx = st
for _, ax in enumerate(axes.flat):

    if idx>=308:
        break

    hist(streamflow.iloc[:, idx].values.reshape(-1,),
     bins=20,
     ax=ax,
     show=False
    )

    idx += 1

plt.show()
print(idx)
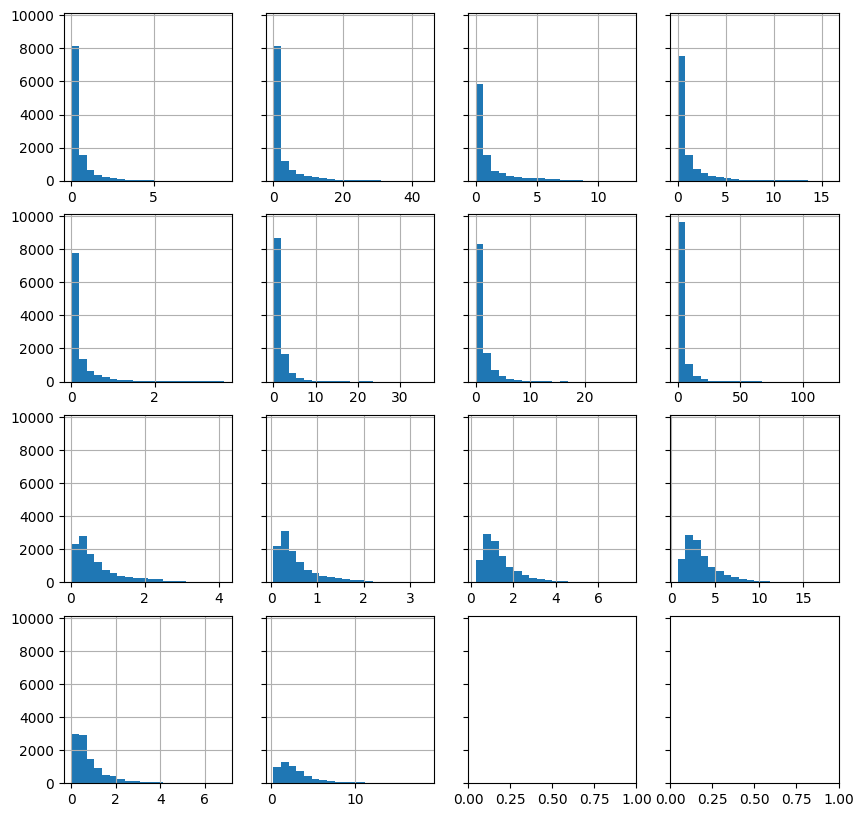
308
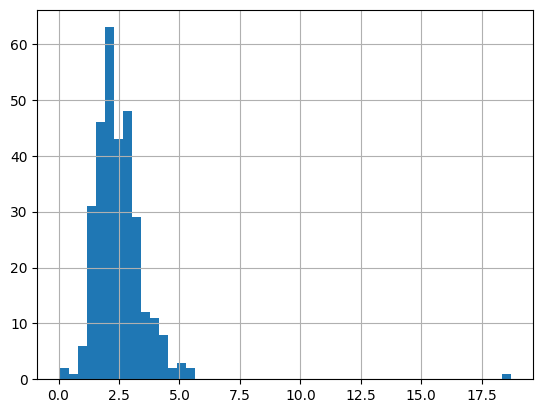
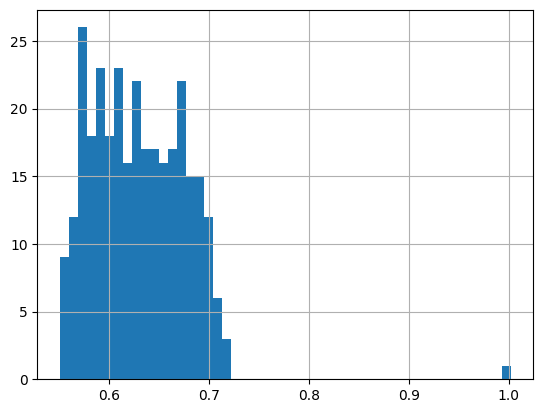
[37]:
# skewness of streamflow

_ = hist(streamflow.skew().values.reshape(-1,), bins=50)
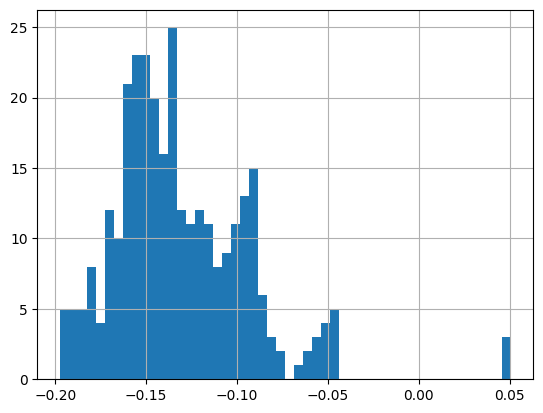
potential evapotranspiration
[41]:
pet = dataset.fetch(dynamic_features = 'potential_evaporation_sum', as_dataframe=True)
pet = pet.reset_index()
pet.index = pd.to_datetime(pet.pop('time'))
pet.pop('dynamic_features')
print(pet.shape)
_ = EDA(data=pet, save=False).heatmap()
(14609, 308)

[42]:
_ = hist(pet.skew().values.reshape(-1,), bins=50)
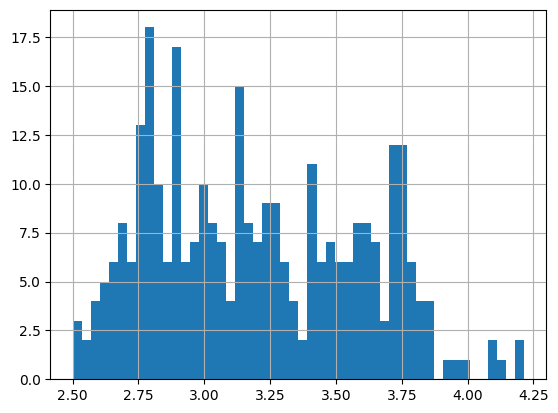
Air Temperature
[44]:
temp = dataset.fetch(dynamic_features = 'temperature_2m_mean', as_dataframe=True)
temp = temp.reset_index()
temp.index = pd.to_datetime(temp.pop('time'))
temp.pop('dynamic_features')

print(temp.shape)

_ = EDA(data=temp, save=False).heatmap()
(14609, 308)

[45]:
_ = hist(temp.skew().values.reshape(-1,), bins=50)
Precipitation
[48]:
pcp = dataset.fetch(dynamic_features = 'total_precipitation_sum', as_dataframe=True)
pcp = pcp.reset_index()
pcp.index = pd.to_datetime(pcp.pop('time'))
pcp.pop('dynamic_features')
print(pcp.shape)
_ = EDA(data=pcp, save=False).heatmap()
(14609, 308)

[49]:
_ = hist(pcp.skew().values.reshape(-1,), bins=50)
[ ]: