CAMELS Britain
![]()
![]()
This notebook explores CAMELS Britain dataset which introduced by Coxon et al., 2020.
[1]:
from ai4water.eda import EDA
from ai4water.datasets import CAMELS_GB
from ai4water.utils.utils import get_version_info

import pandas as pd
import numpy as np

import matplotlib.pyplot as plt

from easy_mpl import hist, ridge
from easy_mpl import scatter
from easy_mpl.utils import process_cbar
**********Tensorflow models could not be imported **********
C:\Users\ather\.conda\envs\cat_aware\lib\site-packages\sklearn\experimental\enable_hist_gradient_boosting.py:15: UserWarning: Since version 1.0, it is not needed to import enable_hist_gradient_boosting anymore. HistGradientBoostingClassifier and HistGradientBoostingRegressor are now stable and can be normally imported from sklearn.ensemble.
  warnings.warn(
[2]:
for k,v in get_version_info().items():
    print(k, v)
python 3.8.17 (default, Jul  5 2023, 20:44:21) [MSC v.1916 64 bit (AMD64)]
os nt
ai4water 1.07
easy_mpl 0.21.3
SeqMetrics 1.3.4
numpy 1.24.3
pandas 1.3.4
matplotlib 3.6.0
sklearn 1.3.0
xarray 0.20.1
netCDF4 1.5.7
seaborn 0.12.2
[4]:
dataset = CAMELS_GB(
    path=r"E:\data\gscad\CAMELS\CAMELS_GB"   # set path to None if you have not already downloaded data
)
[5]:
dataset.start
[5]:
Timestamp('1970-10-01 00:00:00')
[6]:
dataset.end
[6]:
Timestamp('2015-09-30 00:00:00')
[7]:
stations = dataset.stations()
len(stations)
[7]:
671
Static Data
[8]:
dataset.static_features
[8]:
['p_mean',
 'pet_mean',
 'aridity',
 'p_seasonality',
 'frac_snow',
 'high_prec_freq',
 'high_prec_dur',
 'high_prec_timing',
 'low_prec_freq',
 'low_prec_dur',
 'low_prec_timing',
 'benchmark_catch',
 'surfacewater_abs',
 'groundwater_abs',
 'discharges',
 'abs_agriculture_perc',
 'abs_amenities_perc',
 'abs_energy_perc',
 'abs_environmental_perc',
 'abs_industry_perc',
 'abs_watersupply_perc',
 'num_reservoir',
 'reservoir_cap',
 'reservoir_he',
 'reservoir_nav',
 'reservoir_drain',
 'reservoir_wr',
 'reservoir_fs',
 'reservoir_env',
 'reservoir_nousedata',
 'reservoir_year_first',
 'reservoir_year_last',
 'inter_high_perc',
 'inter_mod_perc',
 'inter_low_perc',
 'frac_high_perc',
 'frac_mod_perc',
 'frac_low_perc',
 'no_gw_perc',
 'low_nsig_perc',
 'nsig_low_perc',
 'q_mean',
 'runoff_ratio',
 'stream_elas',
 'slope_fdc',
 'baseflow_index',
 'baseflow_index_ceh',
 'hfd_mean',
 'Q5',
 'Q95',
 'high_q_freq',
 'high_q_dur',
 'low_q_freq',
 'low_q_dur',
 'zero_q_freq',
 'station_type',
 'flow_period_start',
 'flow_period_end',
 'flow_perc_complete',
 'bankfull_flow',
 'structurefull_flow',
 'q5_uncert_upper',
 'q5_uncert_lower',
 'q25_uncert_upper',
 'q25_uncert_lower',
 'q50_uncert_upper',
 'q50_uncert_lower',
 'q75_uncert_upper',
 'q75_uncert_lower',
 'q95_uncert_upper',
 'q95_uncert_lower',
 'q99_uncert_upper',
 'q99_uncert_lower',
 'quncert_meta',
 'dwood_perc',
 'ewood_perc',
 'grass_perc',
 'shrub_perc',
 'crop_perc',
 'urban_perc',
 'inwater_perc',
 'bares_perc',
 'dom_land_cover',
 'sand_perc',
 'sand_perc_missing',
 'silt_perc',
 'silt_perc_missing',
 'clay_perc',
 'clay_perc_missing',
 'organic_perc',
 'organic_perc_missing',
 'bulkdens',
 'bulkdens_missing',
 'bulkdens_5',
 'bulkdens_50',
 'bulkdens_95',
 'tawc',
 'tawc_missing',
 'tawc_5',
 'tawc_50',
 'tawc_95',
 'porosity_cosby',
 'porosity_cosby_missing',
 'porosity_cosby_5',
 'porosity_cosby_50',
 'porosity_cosby_95',
 'porosity_hypres',
 'porosity_hypres_missing',
 'porosity_hypres_5',
 'porosity_hypres_50',
 'porosity_hypres_95',
 'conductivity_cosby',
 'conductivity_cosby_missing',
 'conductivity_cosby_5',
 'conductivity_cosby_50',
 'conductivity_cosby_95',
 'conductivity_hypres',
 'conductivity_hypres_missing',
 'conductivity_hypres_5',
 'conductivity_hypres_50',
 'conductivity_hypres_95',
 'root_depth',
 'root_depth_missing',
 'root_depth_5',
 'root_depth_50',
 'root_depth_95',
 'soil_depth_pelletier',
 'soil_depth_pelletier_missing',
 'soil_depth_pelletier_5',
 'soil_depth_pelletier_50',
 'soil_depth_pelletier_95',
 'gauge_name',
 'gauge_lat',
 'gauge_lon',
 'gauge_easting',
 'gauge_northing',
 'gauge_elev',
 'area',
 'dpsbar',
 'elev_mean',
 'elev_min',
 'elev_10',
 'elev_50',
 'elev_90',
 'elev_max',
 'p_mean',
 'pet_mean',
 'aridity',
 'p_seasonality',
 'frac_snow',
 'high_prec_freq',
 'high_prec_dur',
 'high_prec_timing',
 'low_prec_freq',
 'low_prec_dur',
 'low_prec_timing',
 'benchmark_catch',
 'surfacewater_abs',
 'groundwater_abs',
 'discharges',
 'abs_agriculture_perc',
 'abs_amenities_perc',
 'abs_energy_perc',
 'abs_environmental_perc',
 'abs_industry_perc',
 'abs_watersupply_perc',
 'num_reservoir',
 'reservoir_cap',
 'reservoir_he',
 'reservoir_nav',
 'reservoir_drain',
 'reservoir_wr',
 'reservoir_fs',
 'reservoir_env',
 'reservoir_nousedata',
 'reservoir_year_first',
 'reservoir_year_last',
 'inter_high_perc',
 'inter_mod_perc',
 'inter_low_perc',
 'frac_high_perc',
 'frac_mod_perc',
 'frac_low_perc',
 'no_gw_perc',
 'low_nsig_perc',
 'nsig_low_perc',
 'q_mean',
 'runoff_ratio',
 'stream_elas',
 'slope_fdc',
 'baseflow_index',
 'baseflow_index_ceh',
 'hfd_mean',
 'Q5',
 'Q95',
 'high_q_freq',
 'high_q_dur',
 'low_q_freq',
 'low_q_dur',
 'zero_q_freq',
 'station_type',
 'flow_period_start',
 'flow_period_end',
 'flow_perc_complete',
 'bankfull_flow',
 'structurefull_flow',
 'q5_uncert_upper',
 'q5_uncert_lower',
 'q25_uncert_upper',
 'q25_uncert_lower',
 'q50_uncert_upper',
 'q50_uncert_lower',
 'q75_uncert_upper',
 'q75_uncert_lower',
 'q95_uncert_upper',
 'q95_uncert_lower',
 'q99_uncert_upper',
 'q99_uncert_lower',
 'quncert_meta',
 'dwood_perc',
 'ewood_perc',
 'grass_perc',
 'shrub_perc',
 'crop_perc',
 'urban_perc',
 'inwater_perc',
 'bares_perc',
 'dom_land_cover',
 'sand_perc',
 'sand_perc_missing',
 'silt_perc',
 'silt_perc_missing',
 'clay_perc',
 'clay_perc_missing',
 'organic_perc',
 'organic_perc_missing',
 'bulkdens',
 'bulkdens_missing',
 'bulkdens_5',
 'bulkdens_50',
 'bulkdens_95',
 'tawc',
 'tawc_missing',
 'tawc_5',
 'tawc_50',
 'tawc_95',
 'porosity_cosby',
 'porosity_cosby_missing',
 'porosity_cosby_5',
 'porosity_cosby_50',
 'porosity_cosby_95',
 'porosity_hypres',
 'porosity_hypres_missing',
 'porosity_hypres_5',
 'porosity_hypres_50',
 'porosity_hypres_95',
 'conductivity_cosby',
 'conductivity_cosby_missing',
 'conductivity_cosby_5',
 'conductivity_cosby_50',
 'conductivity_cosby_95',
 'conductivity_hypres',
 'conductivity_hypres_missing',
 'conductivity_hypres_5',
 'conductivity_hypres_50',
 'conductivity_hypres_95',
 'root_depth',
 'root_depth_missing',
 'root_depth_5',
 'root_depth_50',
 'root_depth_95',
 'soil_depth_pelletier',
 'soil_depth_pelletier_missing',
 'soil_depth_pelletier_5',
 'soil_depth_pelletier_50',
 'soil_depth_pelletier_95',
 'gauge_name',
 'gauge_lat',
 'gauge_lon',
 'gauge_easting',
 'gauge_northing',
 'gauge_elev',
 'area',
 'dpsbar',
 'elev_mean',
 'elev_min',
 'elev_10',
 'elev_50',
 'elev_90',
 'elev_max']
[9]:
q = ''
lc01 = ''
nvis = ''
anngro = ''
gromega = ''
npp = ''
[10]:
static = dataset.fetch_static_features(stn_id=stations)
static.shape
[10]:
(671, 290)
[11]:
EDA(data=static, save=False).heatmap()
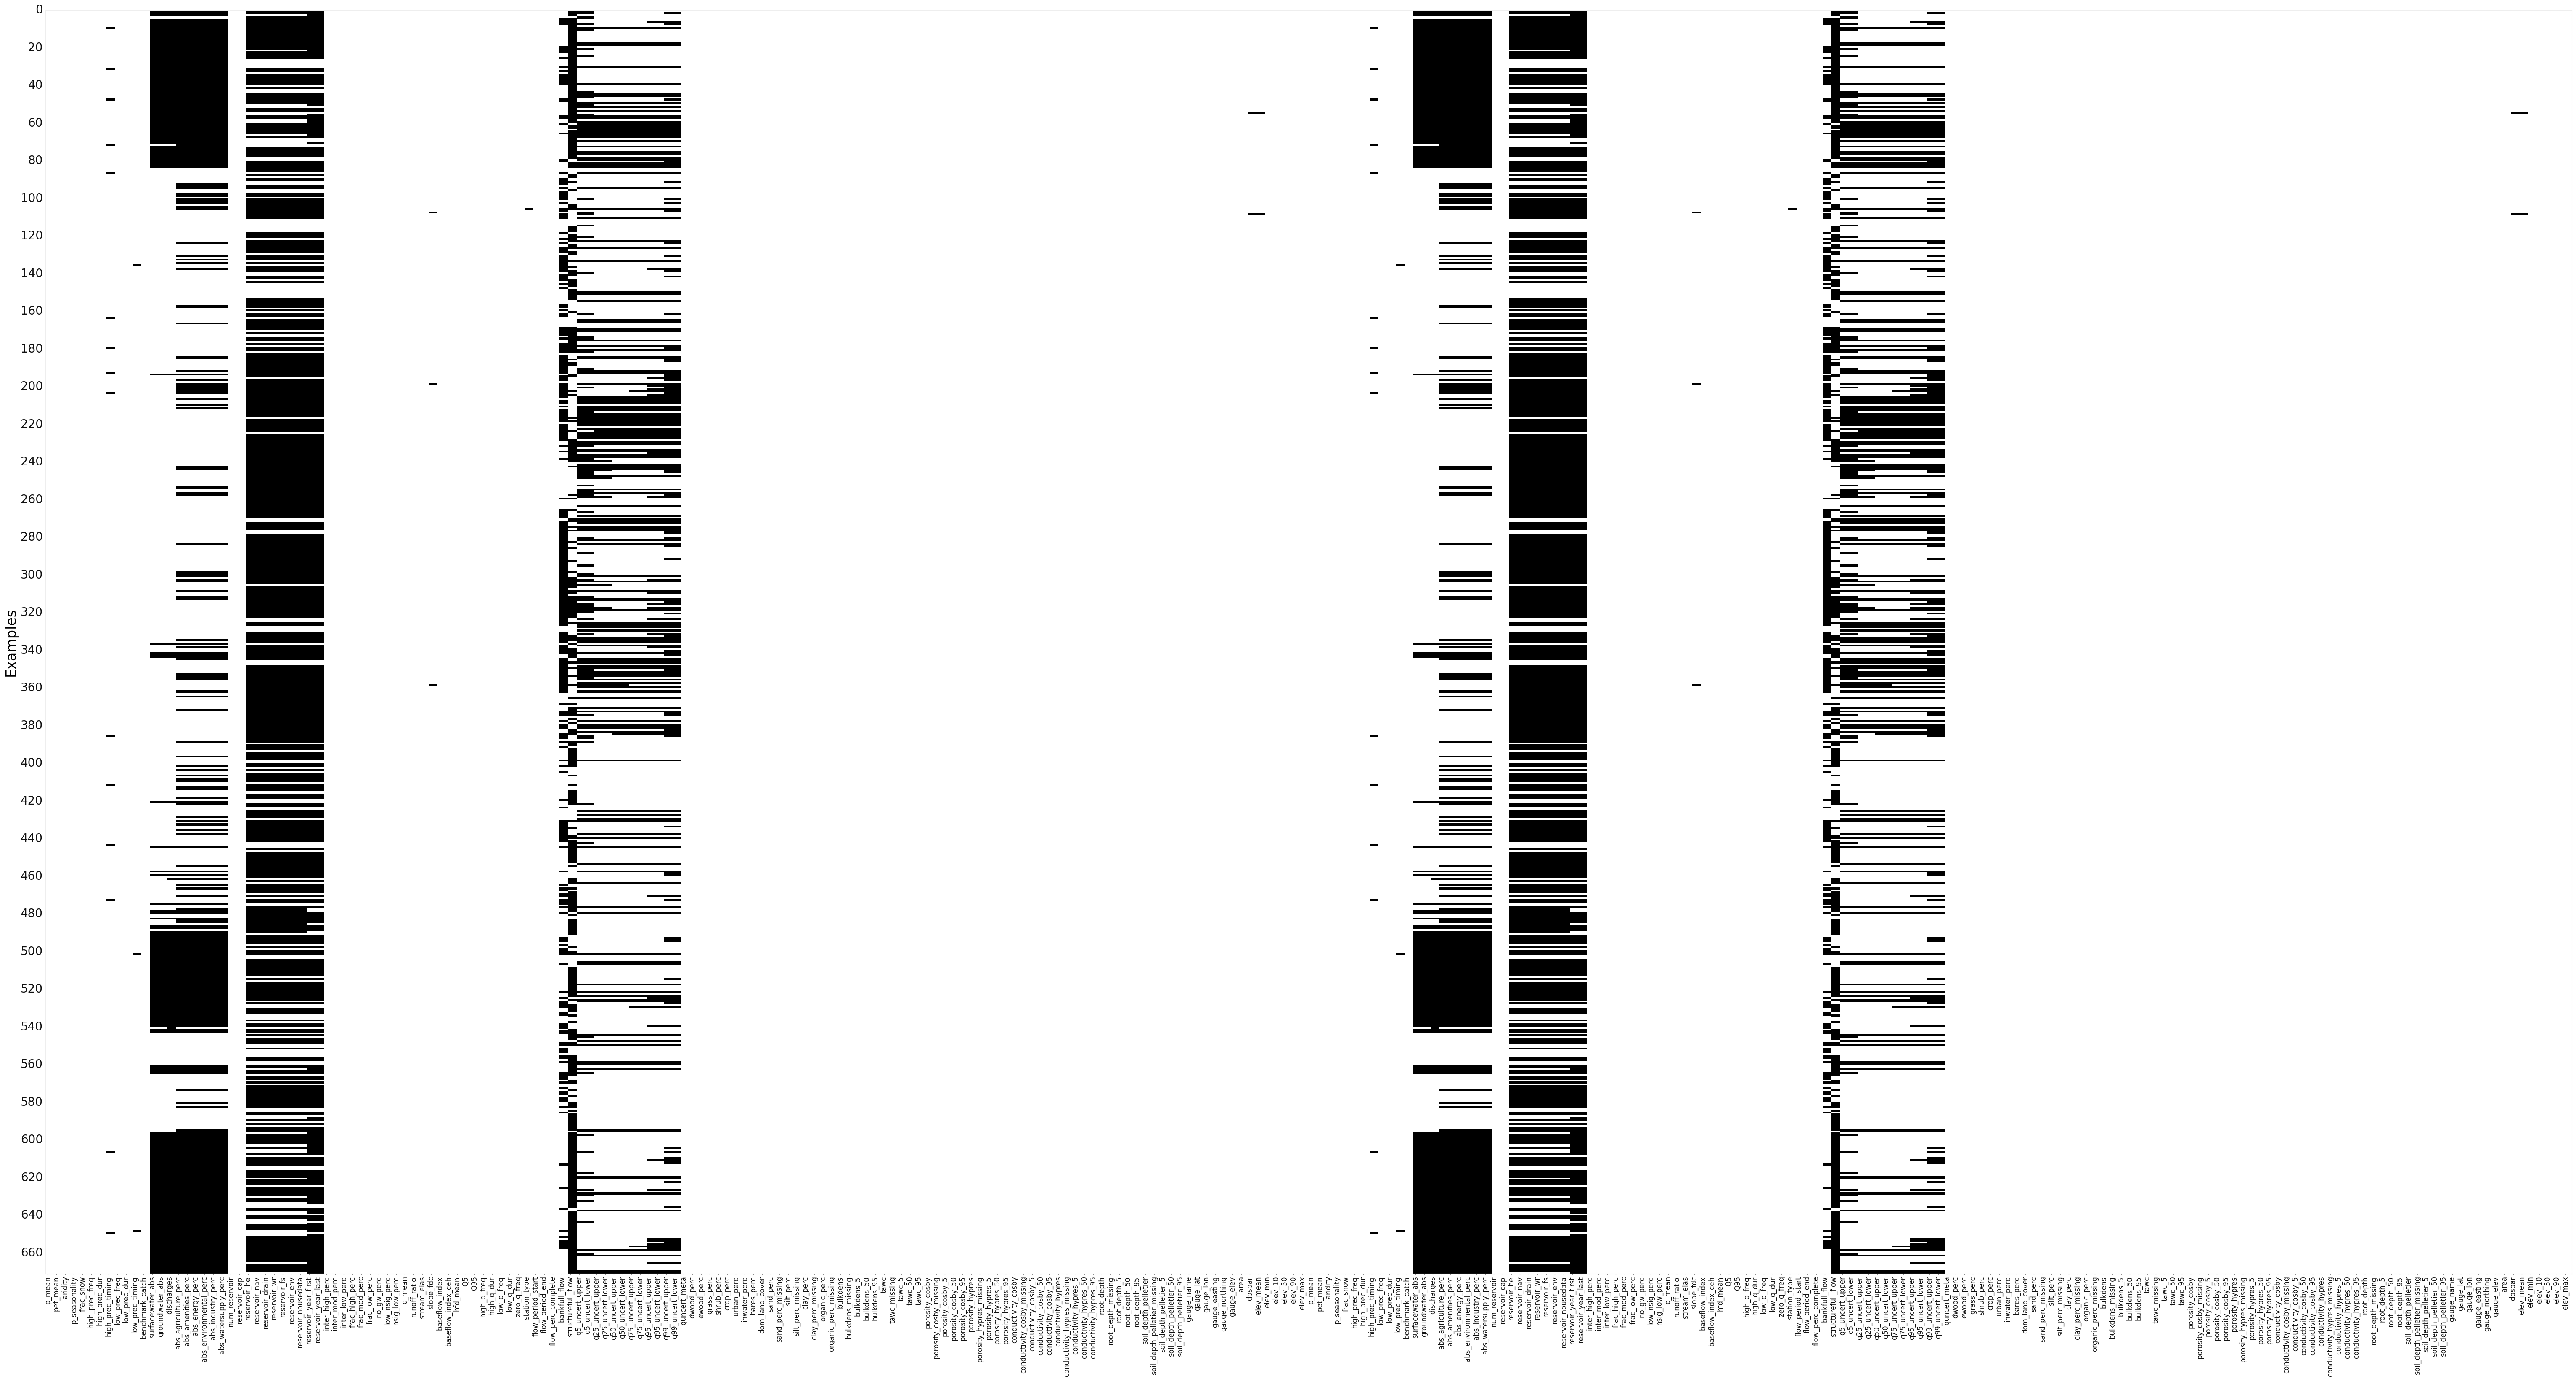
[11]:
<AxesSubplot: ylabel='Examples'>
[12]:
dataset.plot_stations()
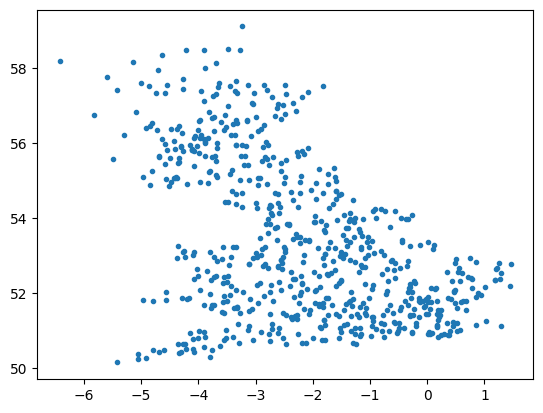
[12]:
<AxesSubplot: >
[13]:
static = static.dropna(axis=1)
static.shape
[13]:
(671, 214)
[18]:
coords = dataset.stn_coords()

lat = coords['lat'].values.reshape(-1,)
long = coords['long'].values.reshape(-1,)
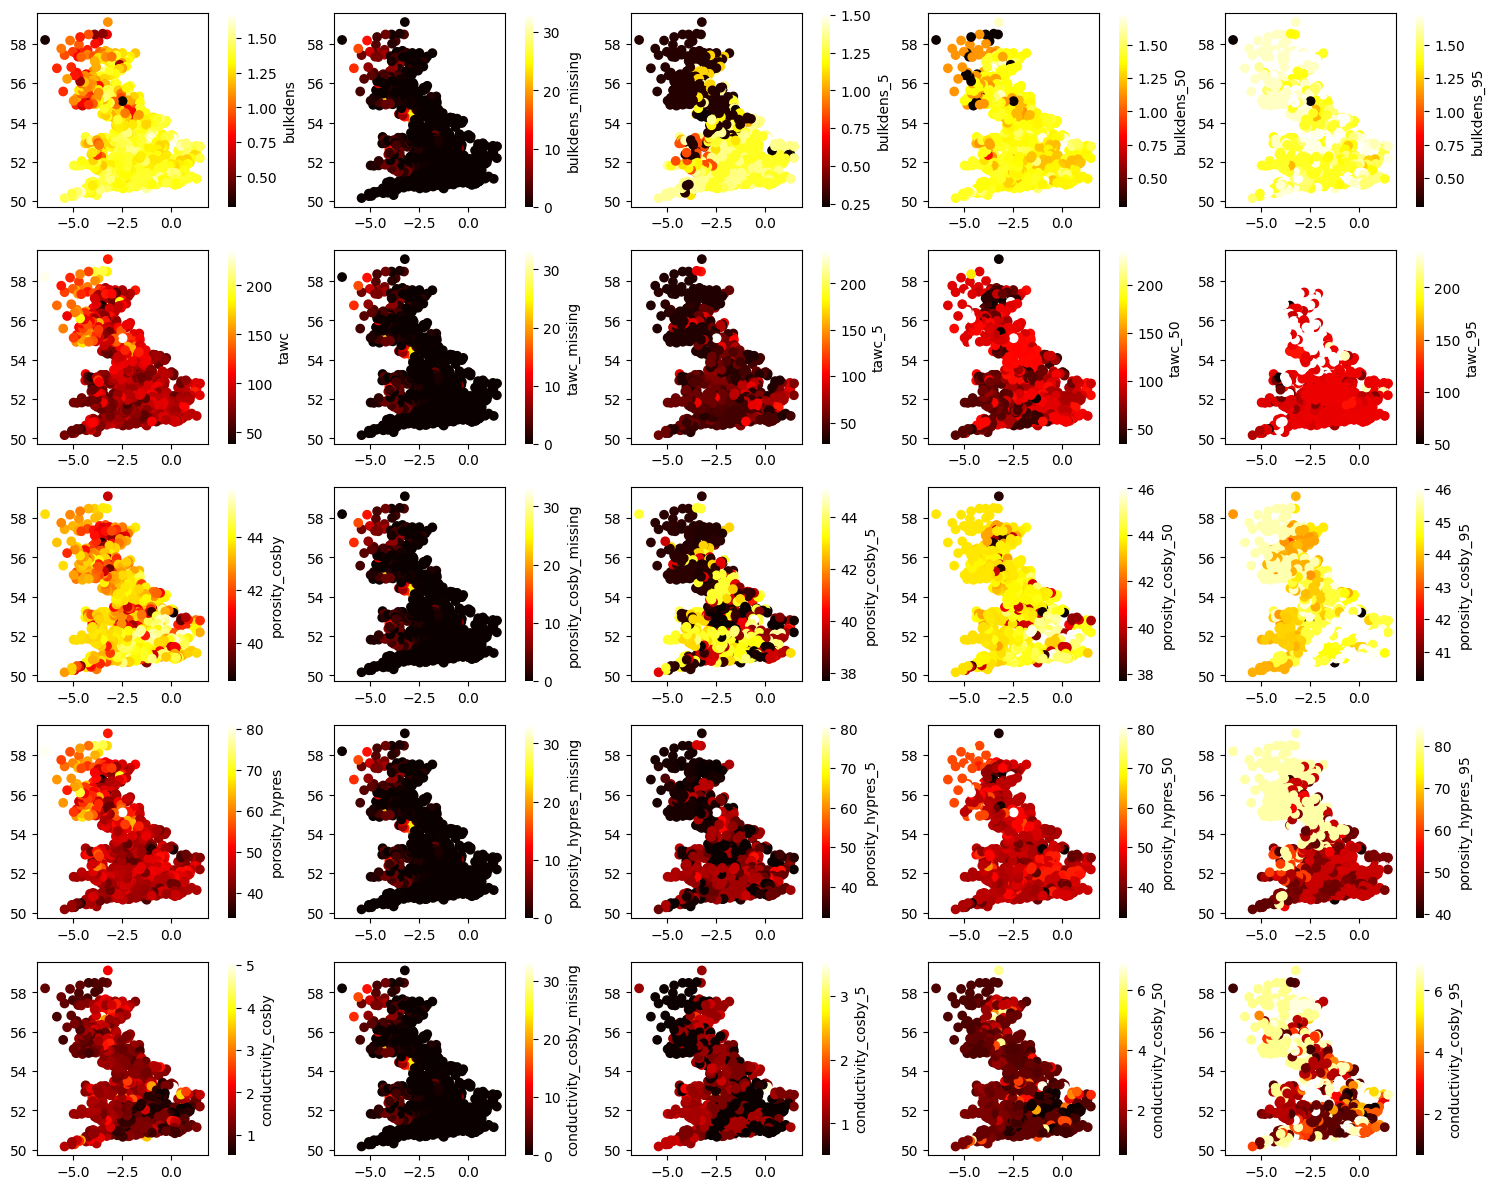
[19]:
idx = 0
ax_num = 0

fig, axes = plt.subplots(5, 5, figsize=(15, 12))
axes = axes.flatten()

while ax_num < 25 and idx<static.shape[1]:

    val = static.iloc[:, idx]
    idx += 1

    try:
        c = val.astype(float).values.reshape(-1,)

        en = static.shape[0]
        ax = axes[ax_num]
        ax, sc = scatter(long[0:en], lat[0:en], c=c[0:en], cmap="hot", show=False, ax=ax)

        process_cbar(ax, sc, border=False, title=val.name, #title_kws ={"fontsize": 14}
                    )
        ax_num += 1
    except ValueError:
        continue

plt.tight_layout()
plt.show()
print(idx)
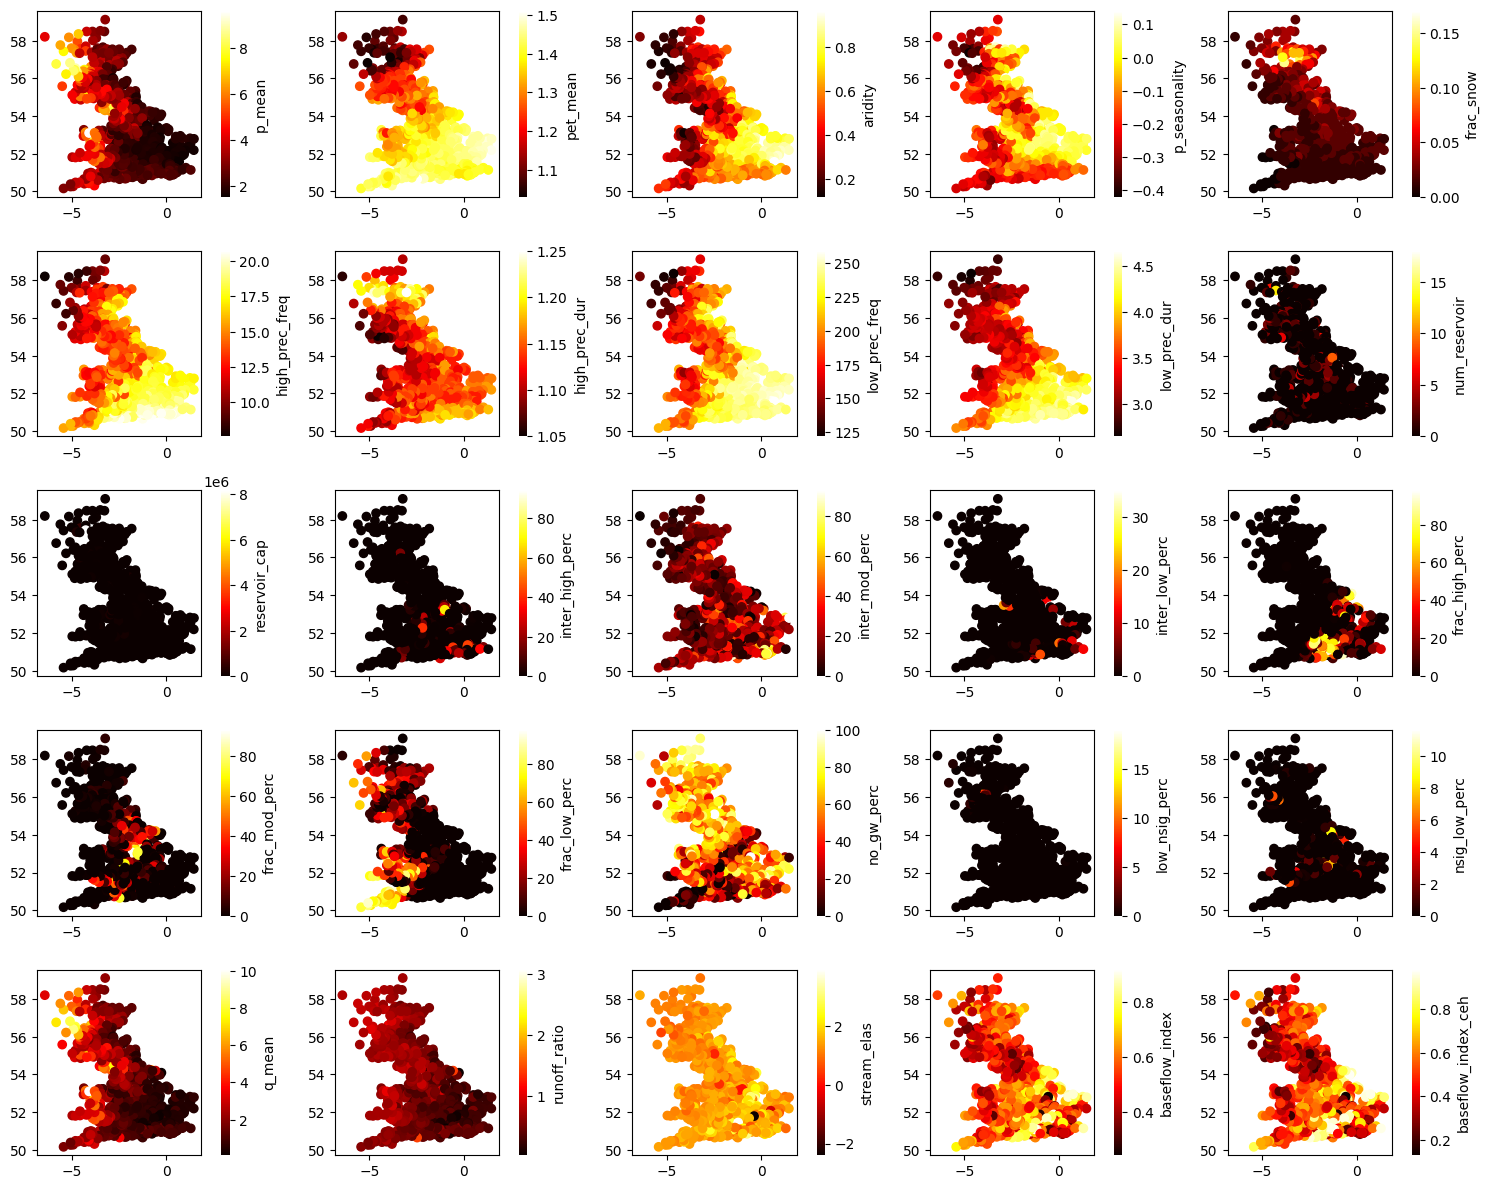
26
[20]:
idx = 26
ax_num = 0

fig, axes = plt.subplots(5, 5, figsize=(15, 12))
axes = axes.flatten()

while ax_num < 25 and idx<static.shape[1]:

    val = static.iloc[:, idx]
    idx += 1

    try:
        c = val.astype(float).values.reshape(-1,)

        en = static.shape[0]
        ax = axes[ax_num]
        ax, sc = scatter(long[0:en], lat[0:en], c=c[0:en], cmap="hot", show=False, ax=ax)

        process_cbar(ax, sc, border=False, title=val.name, #title_kws ={"fontsize": 14}
                    )
        ax_num += 1
    except ValueError:
        continue

plt.tight_layout()
plt.show()
print(idx)
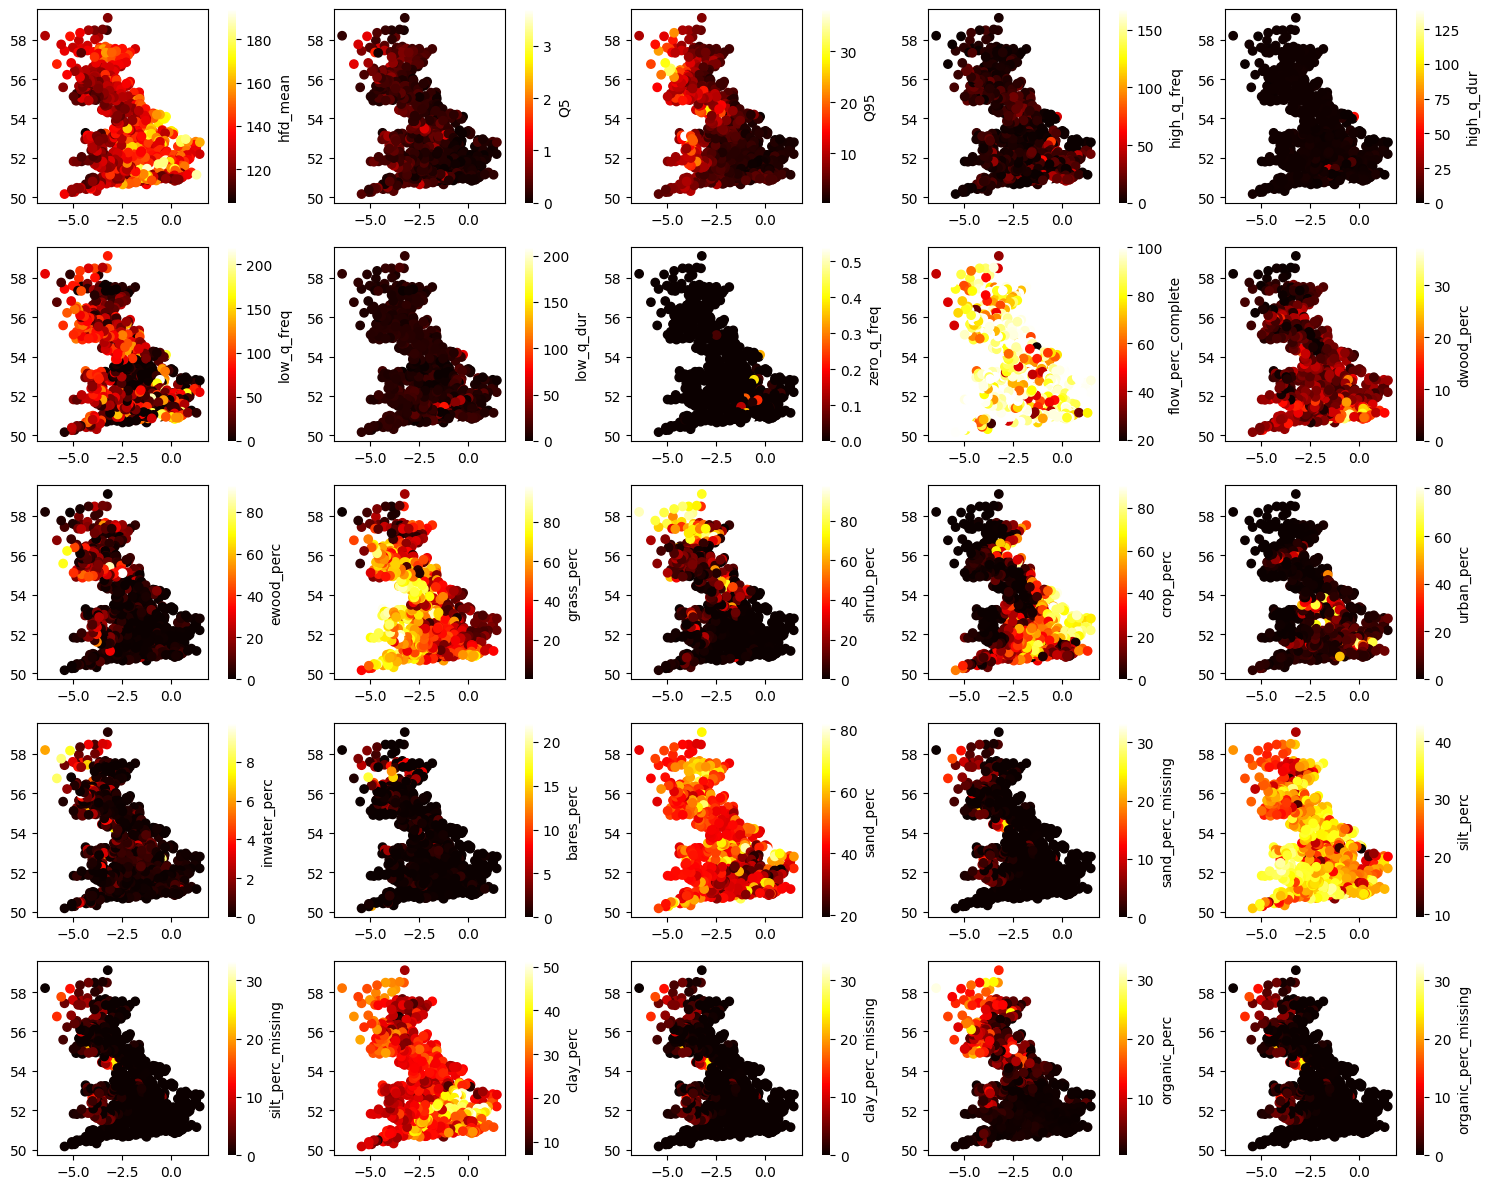
55
[21]:
idx = 55
ax_num = 0

fig, axes = plt.subplots(5, 5, figsize=(15, 12))
axes = axes.flatten()

while ax_num < 25 and idx<static.shape[1]:

    val = static.iloc[:, idx]
    idx += 1

    try:
        c = val.astype(float).values.reshape(-1,)

        en = static.shape[0]
        ax = axes[ax_num]
        ax, sc = scatter(long[0:en], lat[0:en], c=c[0:en], cmap="hot", show=False, ax=ax)

        process_cbar(ax, sc, border=False, title=val.name, #title_kws ={"fontsize": 14}
                    )
        ax_num += 1
    except ValueError:
        continue

plt.tight_layout()
plt.show()
print(idx)
80
[22]:
idx = 80
ax_num = 0

fig, axes = plt.subplots(5, 5, figsize=(15, 12))
axes = axes.flatten()

while ax_num < 25 and idx<static.shape[1]:

    val = static.iloc[:, idx]
    idx += 1

    try:
        c = val.astype(float).values.reshape(-1,)

        en = static.shape[0]
        ax = axes[ax_num]
        ax, sc = scatter(long[0:en], lat[0:en], c=c[0:en], cmap="hot", show=False, ax=ax)

        process_cbar(ax, sc, border=False, title=val.name, #title_kws ={"fontsize": 14}
                    )
        ax_num += 1
    except ValueError:
        continue

plt.tight_layout()
plt.show()
print(idx)
106
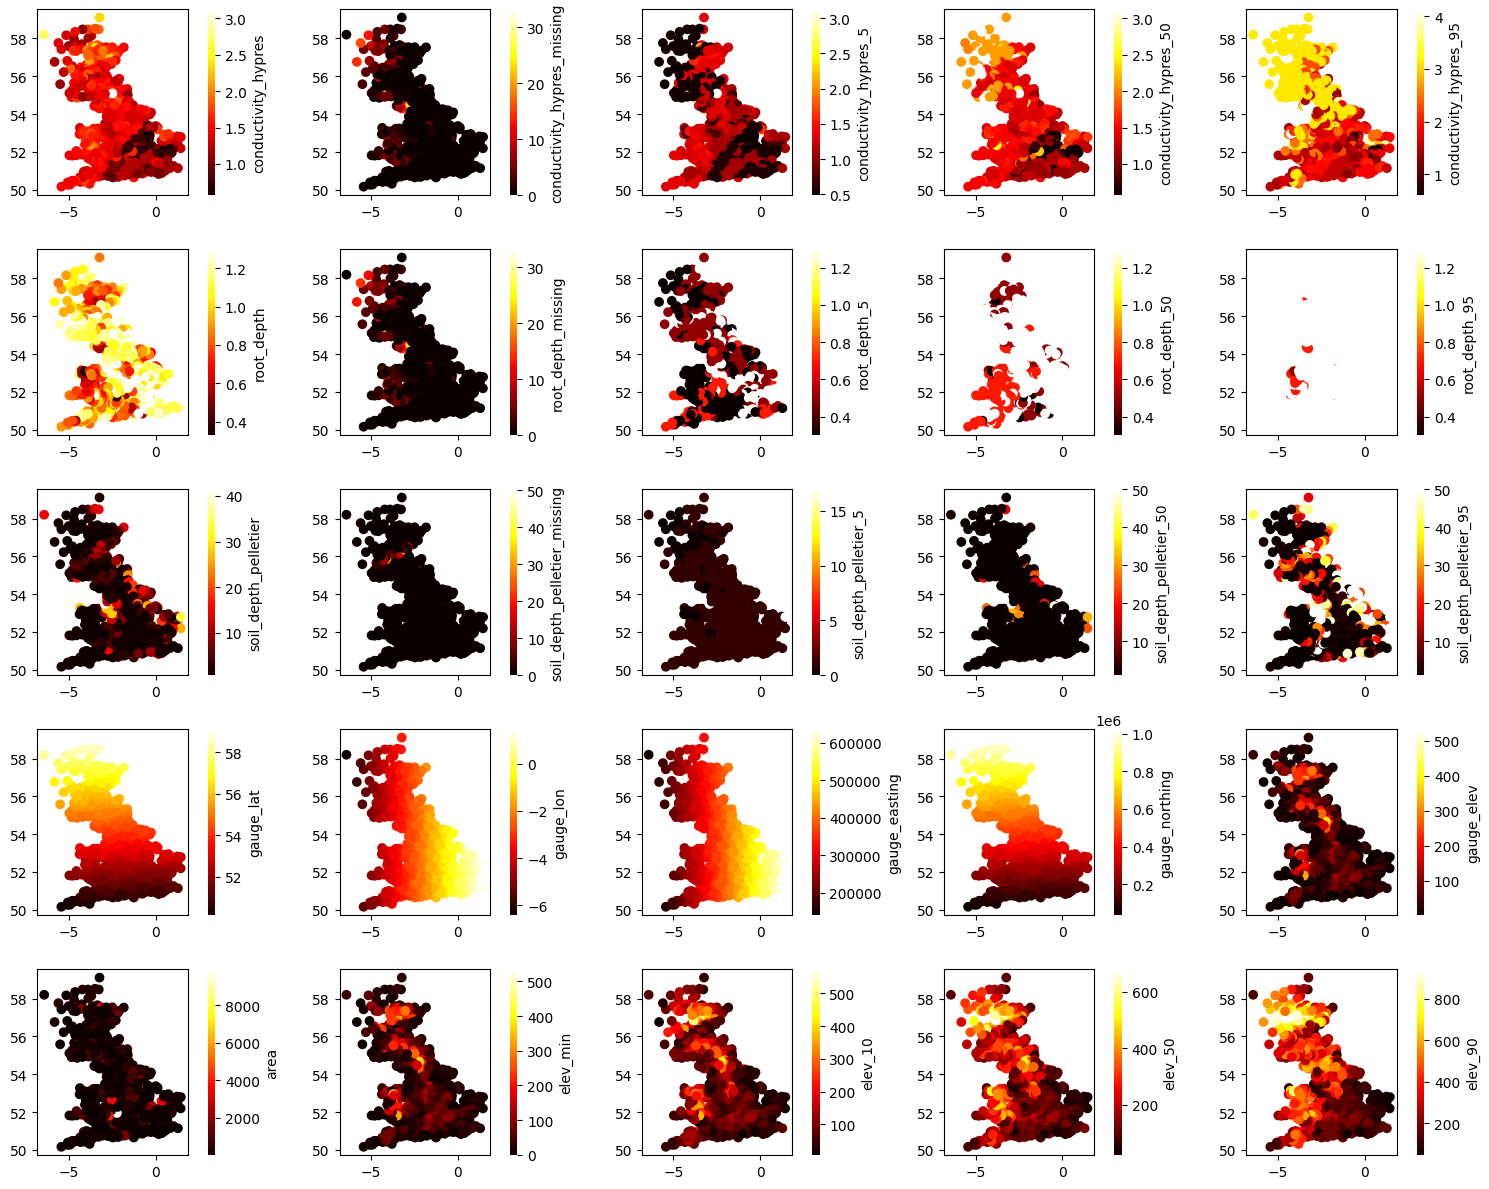
[23]:
idx = 106
ax_num = 0

fig, axes = plt.subplots(5, 5, figsize=(15, 12))
axes = axes.flatten()

while ax_num < 25 and idx<static.shape[1]:

    val = static.iloc[:, idx]
    idx += 1

    try:
        c = val.astype(float).values.reshape(-1,)

        en = static.shape[0]
        ax = axes[ax_num]
        ax, sc = scatter(long[0:en], lat[0:en], c=c[0:en], cmap="hot", show=False, ax=ax)

        process_cbar(ax, sc, border=False, title=val.name, #title_kws ={"fontsize": 14}
                    )
        ax_num += 1
    except ValueError:
        continue

plt.tight_layout()
plt.show()
print(idx)
132
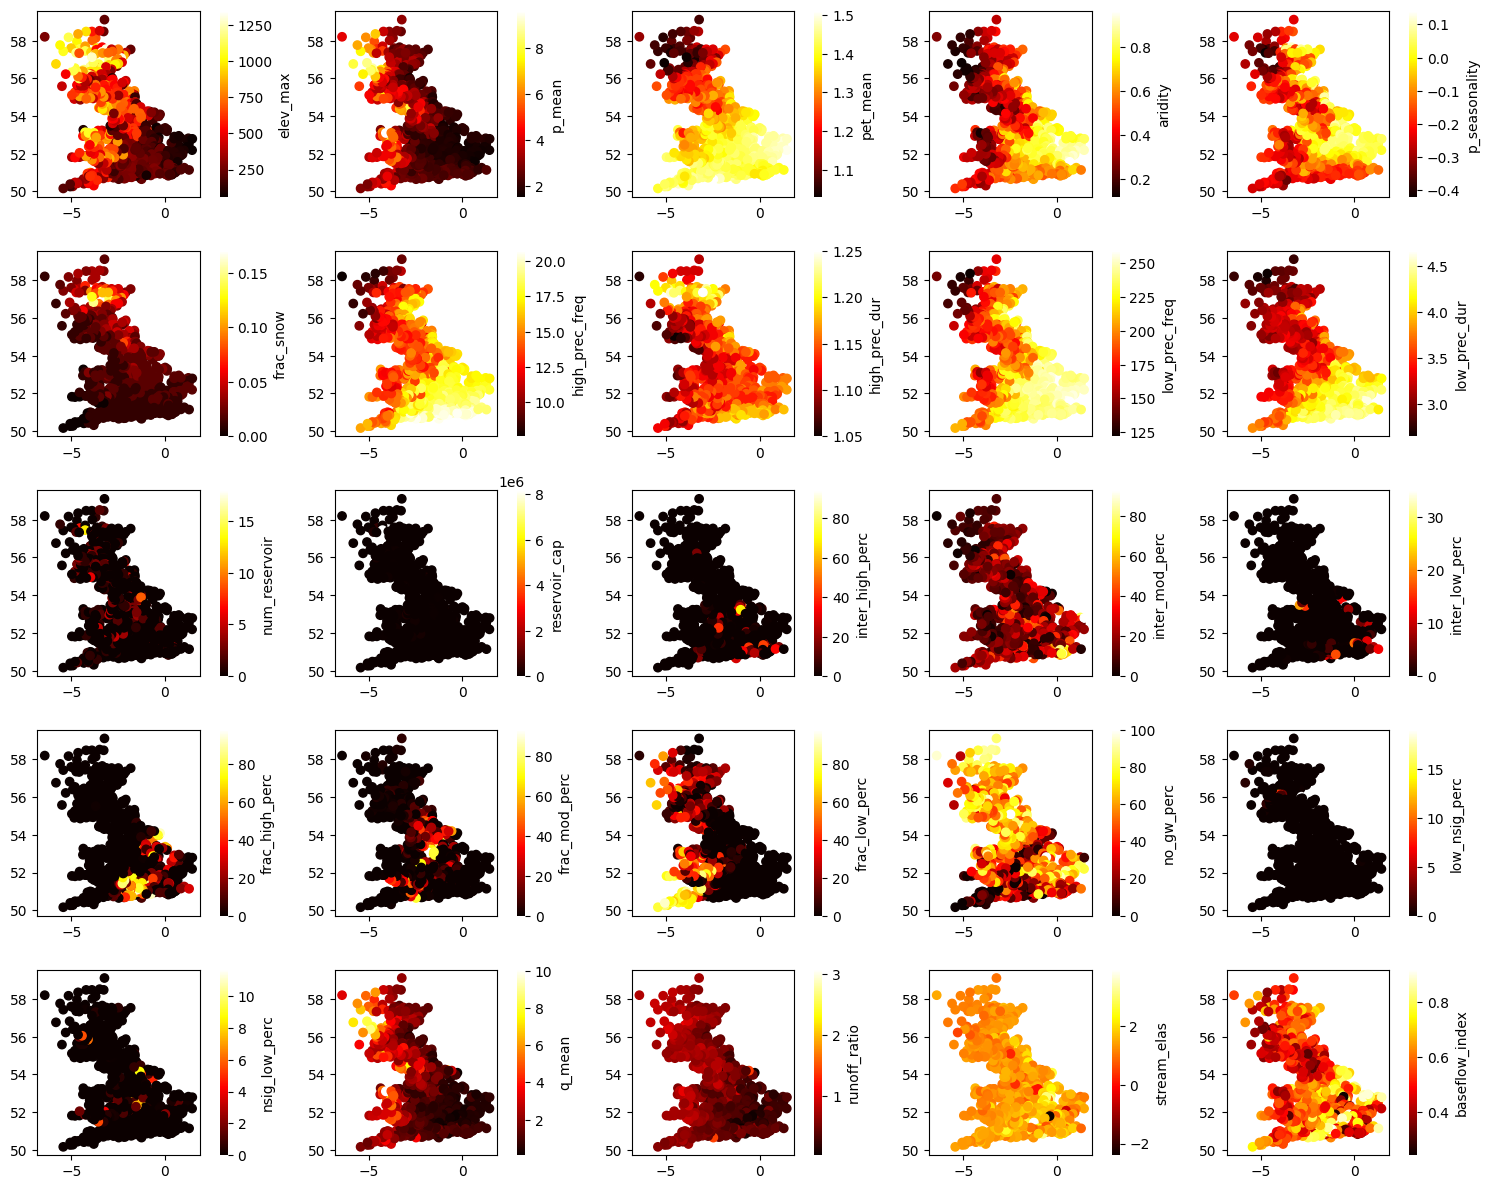
[24]:
idx = 132
ax_num = 0

fig, axes = plt.subplots(5, 5, figsize=(15, 12))
axes = axes.flatten()

while ax_num < 25 and idx<static.shape[1]:

    val = static.iloc[:, idx]
    idx += 1

    try:
        c = val.astype(float).values.reshape(-1,)

        en = static.shape[0]
        ax = axes[ax_num]
        ax, sc = scatter(long[0:en], lat[0:en], c=c[0:en], cmap="hot", show=False, ax=ax)

        process_cbar(ax, sc, border=False, title=val.name, #title_kws ={"fontsize": 14}
                    )
        ax_num += 1
    except ValueError:
        continue

plt.tight_layout()
plt.show()
print(idx)
161
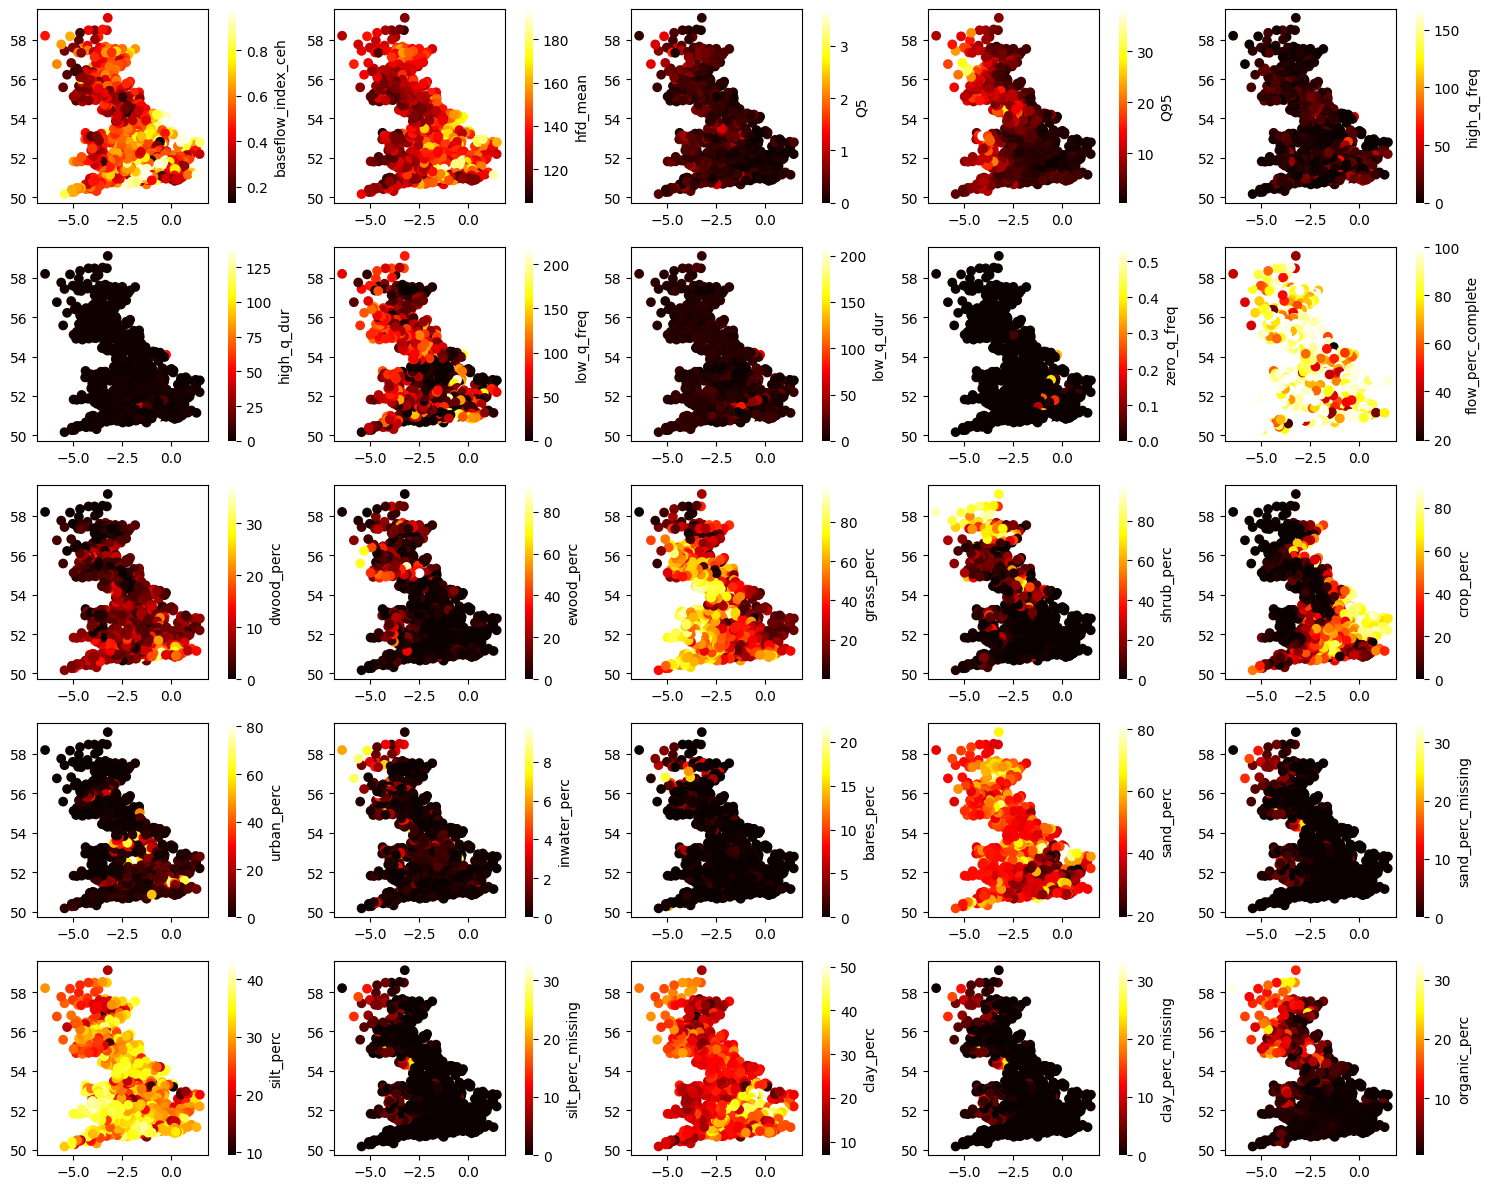
[25]:
idx = 161
ax_num = 0

fig, axes = plt.subplots(5, 5, figsize=(15, 12))
axes = axes.flatten()

while ax_num < 25 and idx<static.shape[1]:

    val = static.iloc[:, idx]
    idx += 1

    try:
        c = val.astype(float).values.reshape(-1,)

        en = static.shape[0]
        ax = axes[ax_num]
        ax, sc = scatter(long[0:en], lat[0:en], c=c[0:en], cmap="hot", show=False, ax=ax)

        process_cbar(ax, sc, border=False, title=val.name, #title_kws ={"fontsize": 14}
                    )
        ax_num += 1
    except ValueError:
        continue

plt.tight_layout()
plt.show()
print(idx)
186
[26]:
idx = 186
ax_num = 0

fig, axes = plt.subplots(5, 5, figsize=(15, 12))
axes = axes.flatten()

while ax_num < 25 and idx<static.shape[1]:

    val = static.iloc[:, idx]
    idx += 1

    try:
        c = val.astype(float).values.reshape(-1,)

        en = static.shape[0]
        ax = axes[ax_num]
        ax, sc = scatter(long[0:en], lat[0:en], c=c[0:en], cmap="hot", show=False, ax=ax)

        process_cbar(ax, sc, border=False, title=val.name, #title_kws ={"fontsize": 14}
                    )
        ax_num += 1
    except ValueError:
        continue

plt.tight_layout()
plt.show()
print(idx)
212
[27]:
idx = 212
ax_num = 0

fig, axes = plt.subplots(5, 5, figsize=(15, 12))
axes = axes.flatten()

while ax_num < 25 and idx<static.shape[1]:

    val = static.iloc[:, idx]
    idx += 1

    try:
        c = val.astype(float).values.reshape(-1,)

        en = static.shape[0]
        ax = axes[ax_num]
        ax, sc = scatter(long[0:en], lat[0:en], c=c[0:en], cmap="hot", show=False, ax=ax)

        process_cbar(ax, sc, border=False, title=val.name, #title_kws ={"fontsize": 14}
                    )
        ax_num += 1
    except ValueError:
        continue

plt.tight_layout()
plt.show()
print(idx)
214
Dynamic Features
[28]:
dataset.dynamic_features
[28]:
['precipitation',
 'pet',
 'temperature',
 'discharge_spec',
 'discharge_vol',
 'peti',
 'humidity',
 'shortwave_rad',
 'longwave_rad',
 'windspeed']
[29]:
streamflow = dataset.q_mmd()
streamflow.shape
[29]:
(16436, 671)
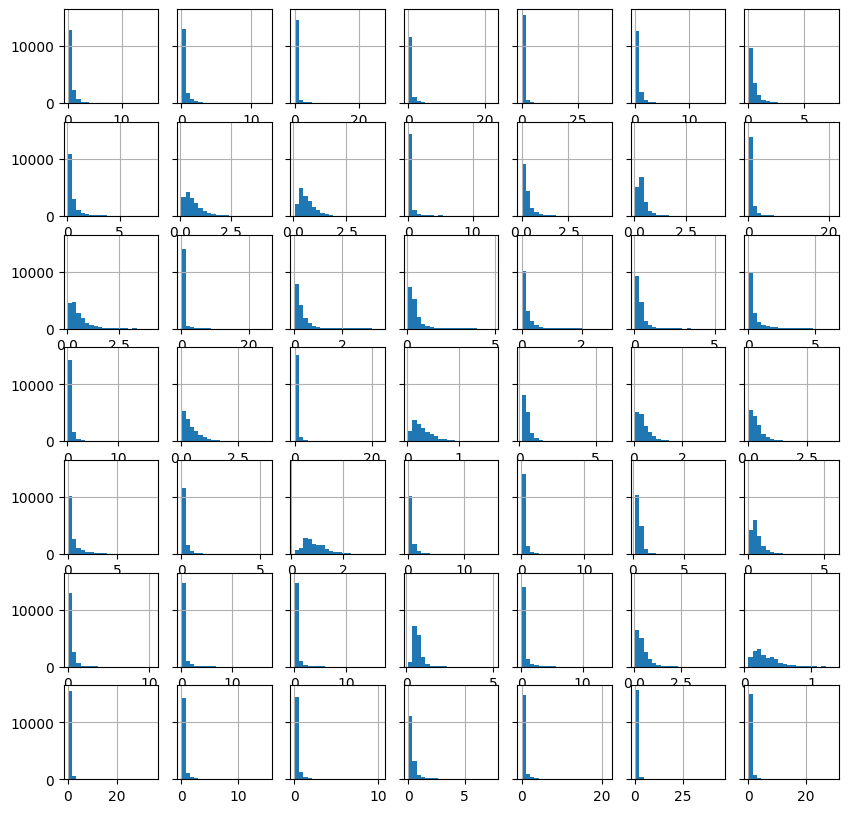
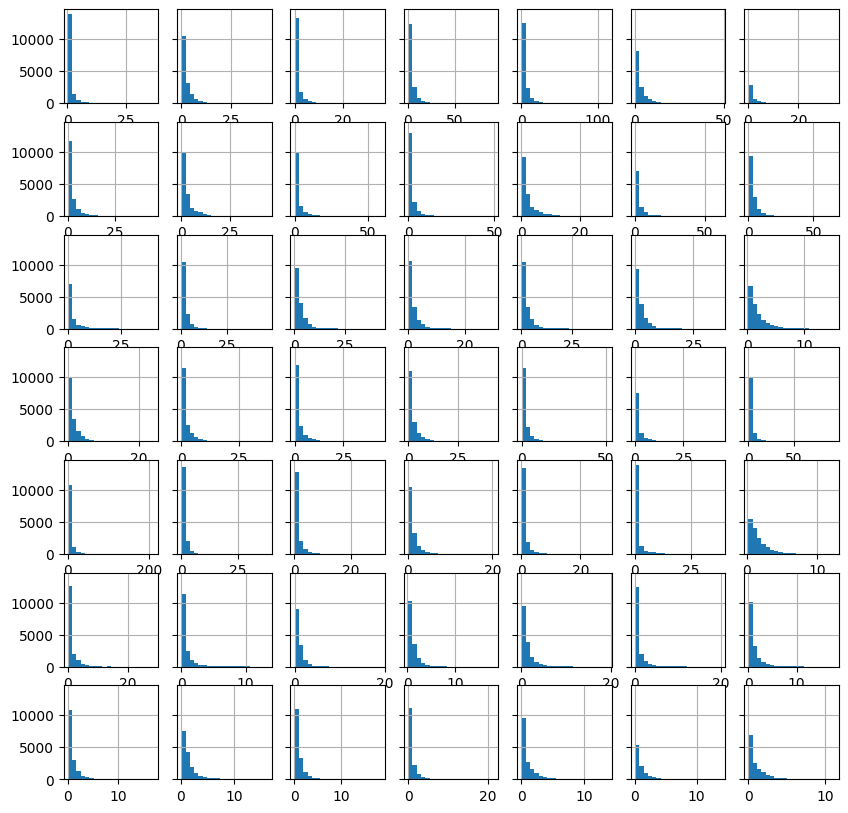
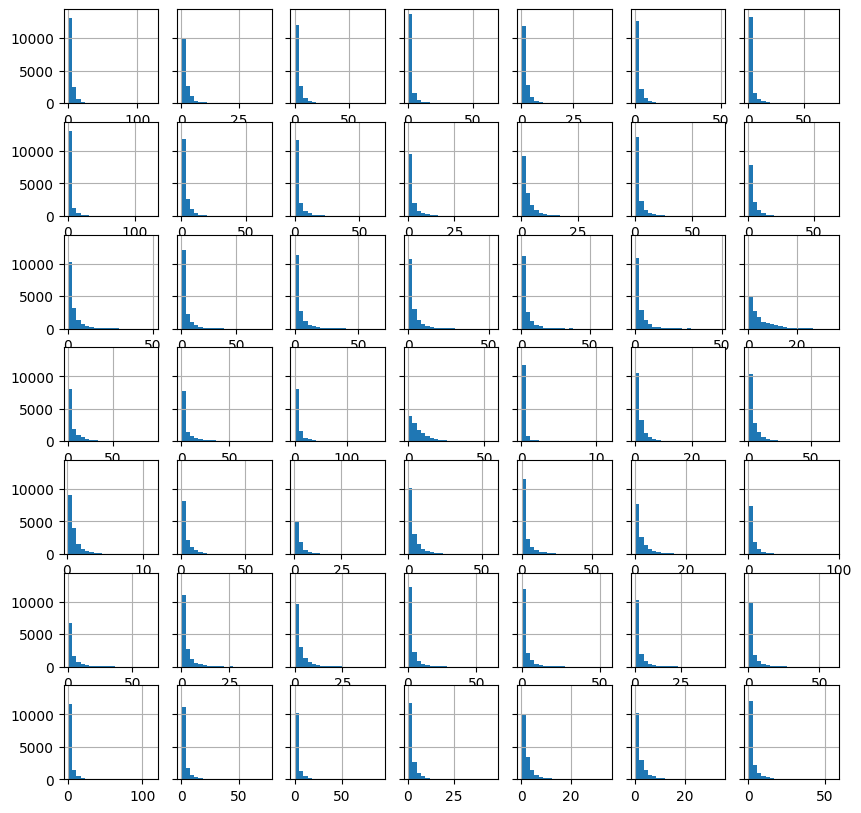
Streamflow
[30]:
EDA(data=streamflow, save=False).heatmap()
[30]:
<AxesSubplot: ylabel='Examples'>
[31]:
st = 0

fig, axes = plt.subplots(7, 7, figsize=(10, 10), sharey="all")

idx = st
for _, ax in enumerate(axes.flat):

    hist(streamflow.iloc[:, idx].values.reshape(-1,),
         bins=20,
         ax=ax,
         show=False
        )

    idx += 1

plt.show()
print(idx)
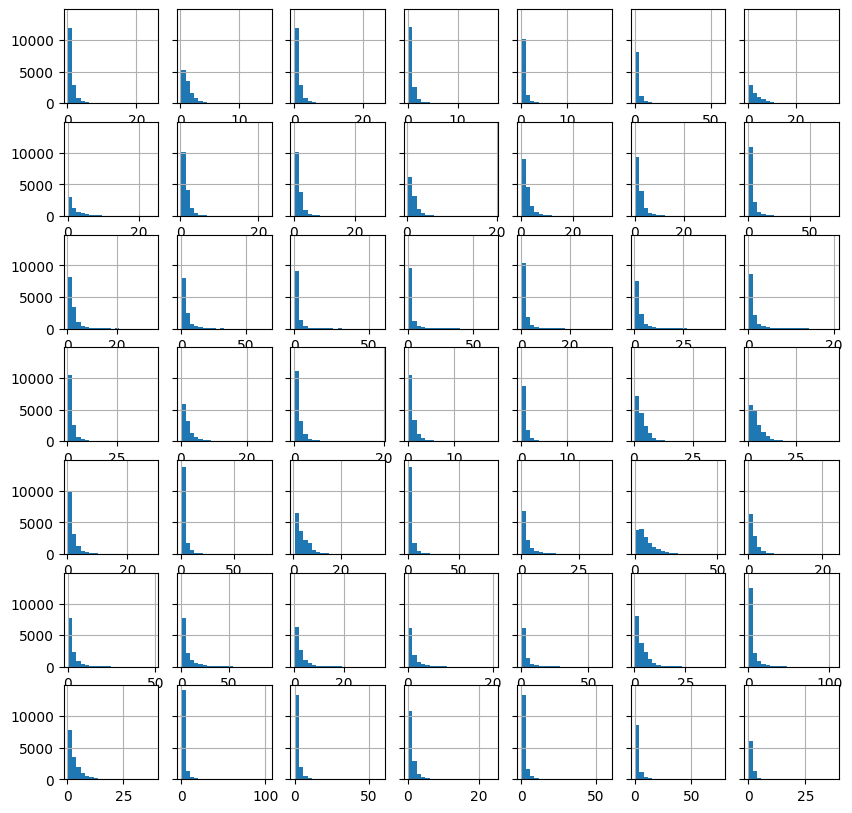
49
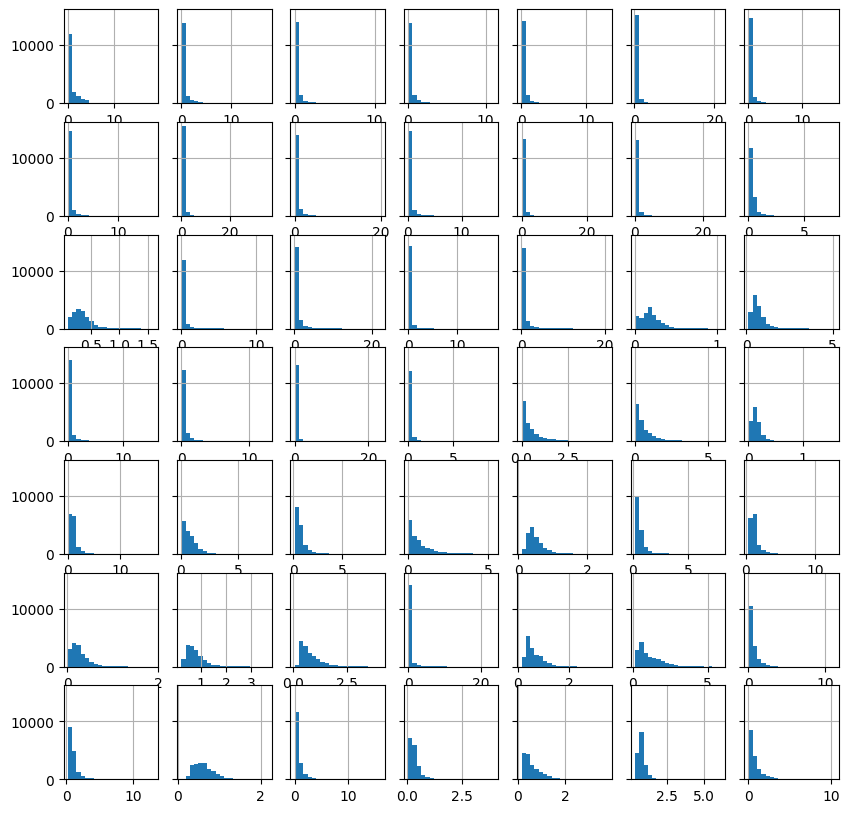
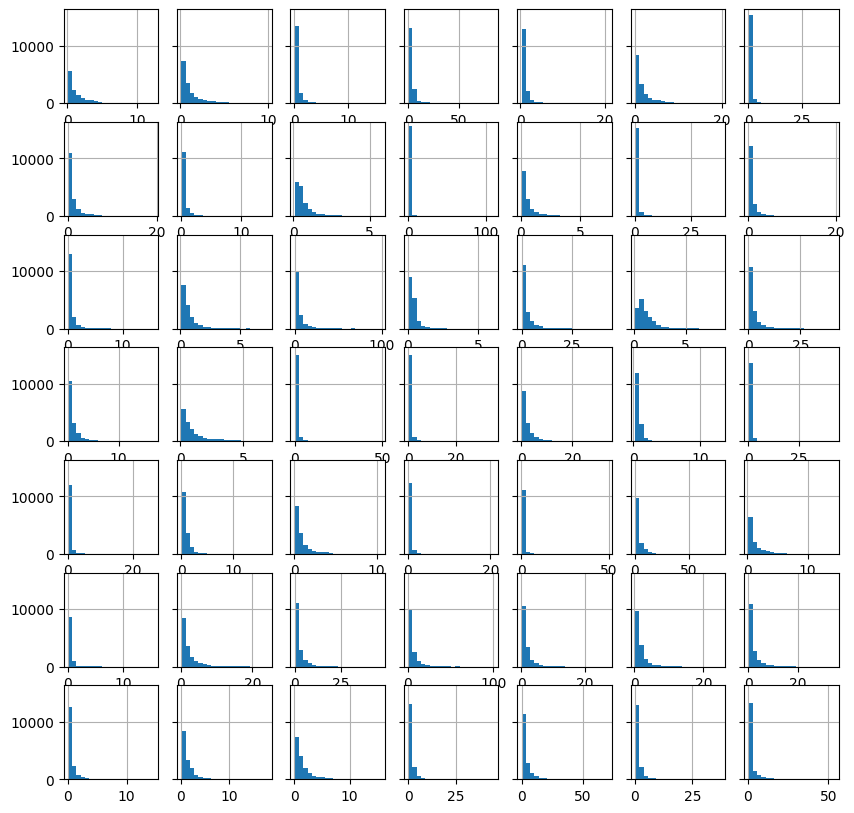
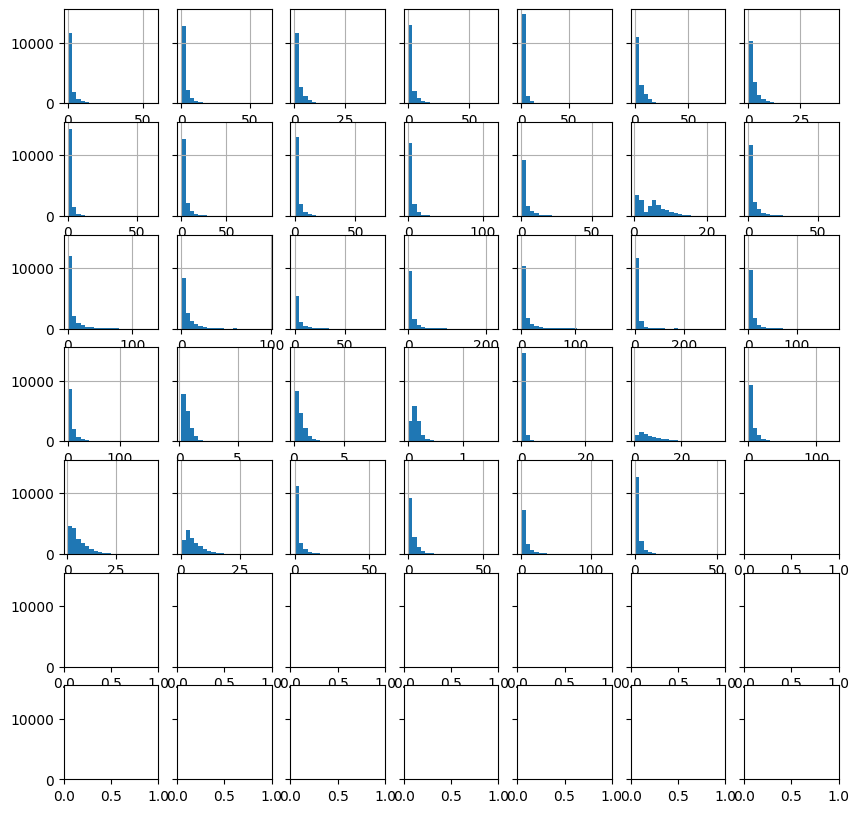
[32]:
st = 49

fig, axes = plt.subplots(7, 7, figsize=(10, 10), sharey="all")

idx = st
for _, ax in enumerate(axes.flat):

    hist(streamflow.iloc[:, idx].values.reshape(-1,),
         bins=20,
         ax=ax,
         show=False
        )

    idx += 1

plt.show()
print(idx)
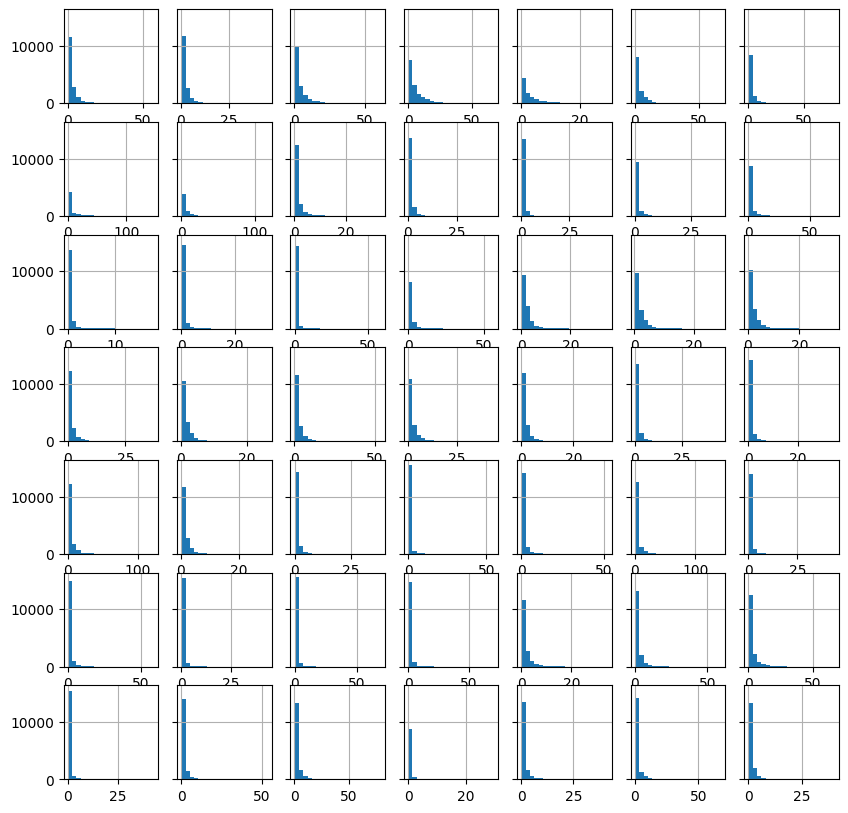
98
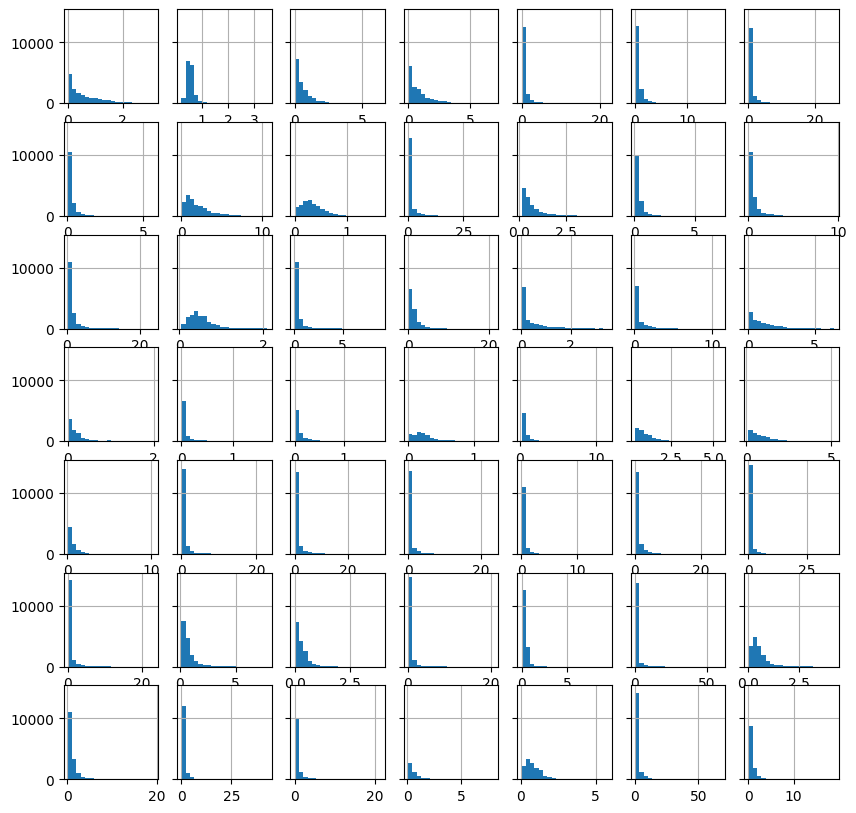
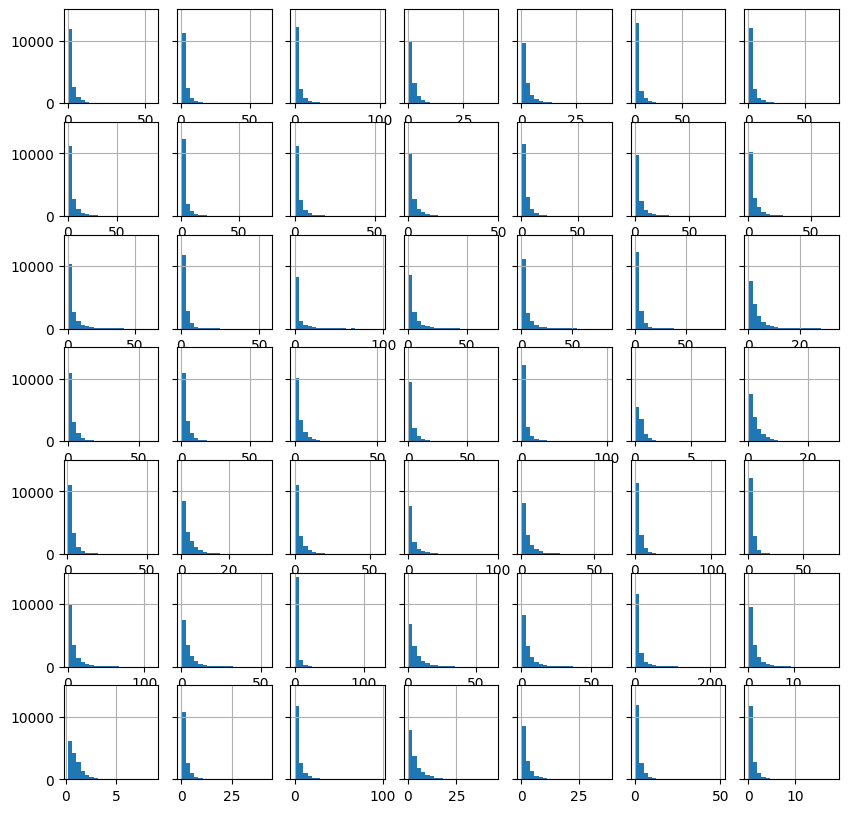
[33]:
st = 98

fig, axes = plt.subplots(7, 7, figsize=(10, 10), sharey="all")

idx = st
for _, ax in enumerate(axes.flat):

    hist(streamflow.iloc[:, idx].values.reshape(-1,),
         bins=20,
         ax=ax,
         show=False
        )

    idx += 1

plt.show()
print(idx)
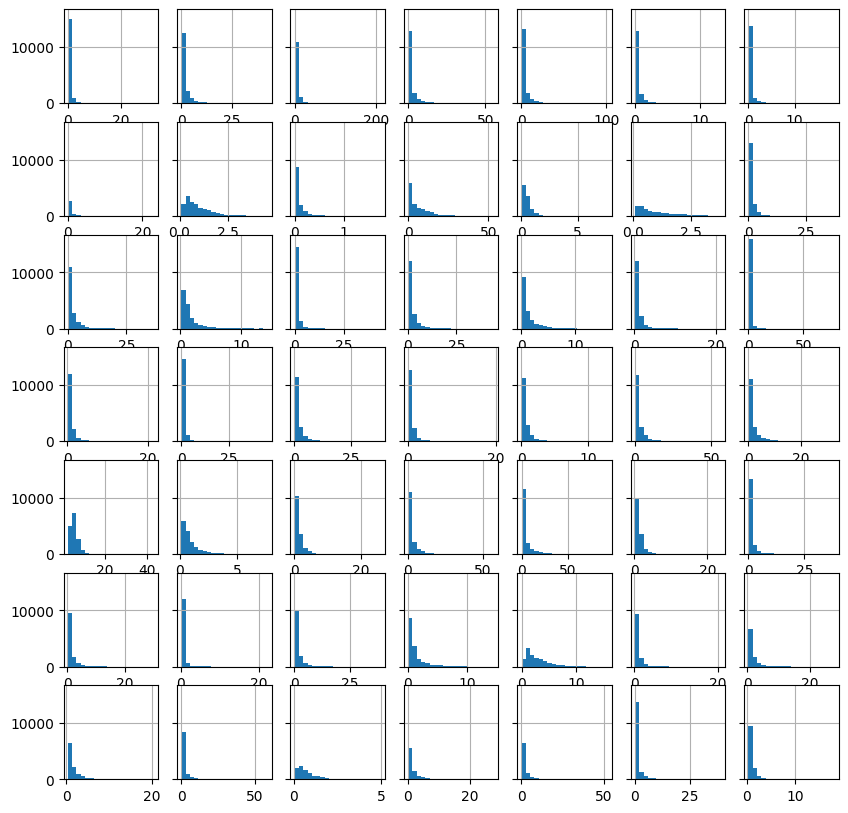
147
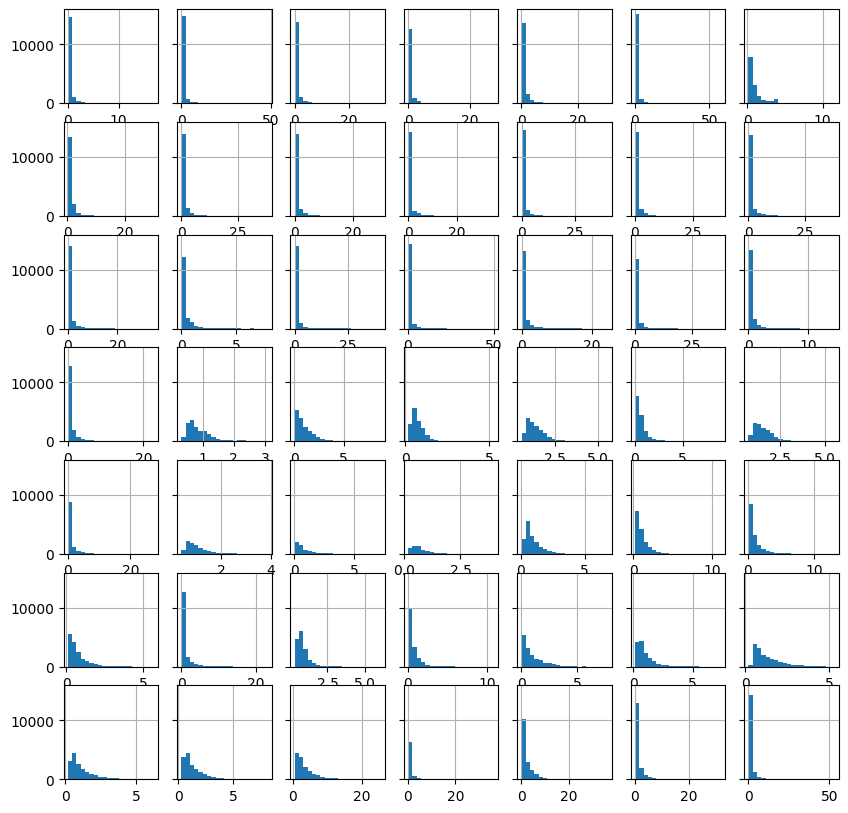
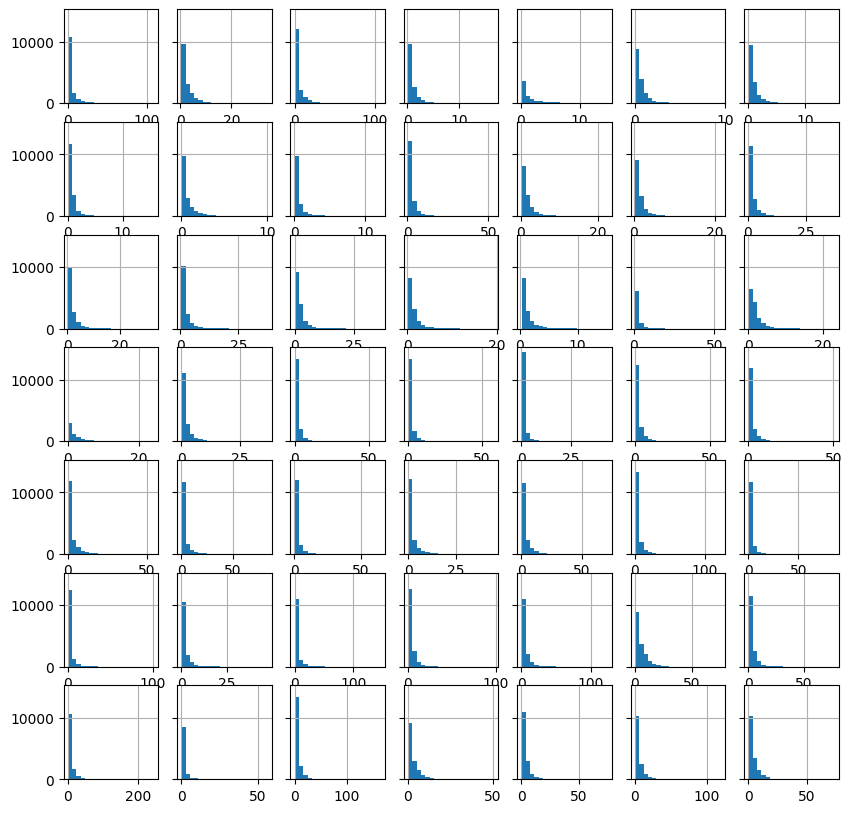
[34]:
st = 147

fig, axes = plt.subplots(7, 7, figsize=(10, 10), sharey="all")

idx = st
for _, ax in enumerate(axes.flat):

    hist(streamflow.iloc[:, idx].values.reshape(-1,),
         bins=20,
         ax=ax,
         show=False
        )

    idx += 1

plt.show()
print(idx)
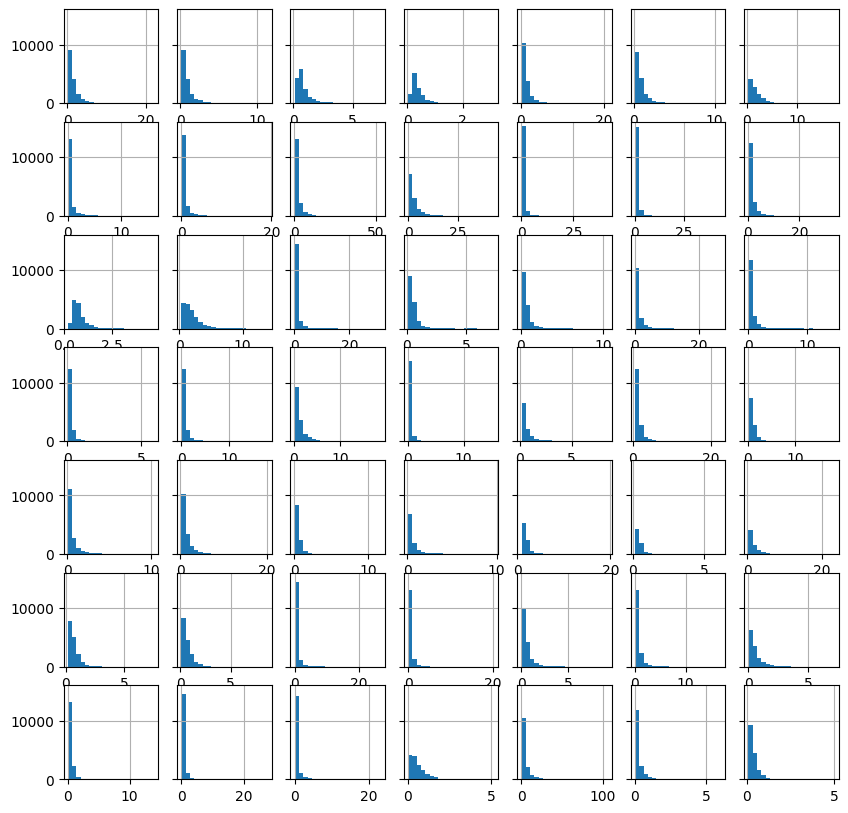
196
[35]:
st = 196

fig, axes = plt.subplots(7, 7, figsize=(10, 10), sharey="all")

idx = st
for _, ax in enumerate(axes.flat):


    hist(streamflow.iloc[:, idx].values.reshape(-1,),
     bins=20,
     ax=ax,
     show=False
    )

    idx += 1

plt.show()
print(idx)
245
[36]:
st = 245

fig, axes = plt.subplots(7, 7, figsize=(10, 10), sharey="all")

idx = st
for _, ax in enumerate(axes.flat):


    hist(streamflow.iloc[:, idx].values.reshape(-1,),
     bins=20,
     ax=ax,
     show=False
    )

    idx += 1

plt.show()
print(idx)
294
[37]:
st = 294

fig, axes = plt.subplots(7, 7, figsize=(10, 10), sharey="all")

idx = st
for _, ax in enumerate(axes.flat):


    hist(streamflow.iloc[:, idx].values.reshape(-1,),
     bins=20,
     ax=ax,
     show=False
    )

    idx += 1

plt.show()
print(idx)
343
[38]:
st = 343

fig, axes = plt.subplots(7, 7, figsize=(10, 10), sharey="all")

idx = st
for _, ax in enumerate(axes.flat):


    hist(streamflow.iloc[:, idx].values.reshape(-1,),
     bins=20,
     ax=ax,
     show=False
    )

    idx += 1

plt.show()
print(idx)
392
[39]:
st = 392

fig, axes = plt.subplots(7, 7, figsize=(10, 10), sharey="all")

idx = st
for _, ax in enumerate(axes.flat):


    hist(streamflow.iloc[:, idx].values.reshape(-1,),
     bins=20,
     ax=ax,
     show=False
    )

    idx += 1

plt.show()
print(idx)
441
[40]:
st = 441

fig, axes = plt.subplots(7, 7, figsize=(10, 10), sharey="all")

idx = st
for _, ax in enumerate(axes.flat):


    hist(streamflow.iloc[:, idx].values.reshape(-1,),
     bins=20,
     ax=ax,
     show=False
    )

    idx += 1

plt.show()
print(idx)
490
[41]:
st = 490

fig, axes = plt.subplots(7, 7, figsize=(10, 10), sharey="all")

idx = st
for _, ax in enumerate(axes.flat):


    hist(streamflow.iloc[:, idx].values.reshape(-1,),
     bins=20,
     ax=ax,
     show=False
    )

    idx += 1

plt.show()
print(idx)
539
[42]:
st = 539

fig, axes = plt.subplots(7, 7, figsize=(10, 10), sharey="all")

idx = st
for _, ax in enumerate(axes.flat):


    hist(streamflow.iloc[:, idx].values.reshape(-1,),
     bins=20,
     ax=ax,
     show=False
    )

    idx += 1

plt.show()
print(idx)
588
[43]:
st = 588

fig, axes = plt.subplots(7, 7, figsize=(10, 10), sharey="all")

idx = st
for _, ax in enumerate(axes.flat):


    hist(streamflow.iloc[:, idx].values.reshape(-1,),
     bins=20,
     ax=ax,
     show=False
    )

    idx += 1

plt.show()
print(idx)
637
[44]:
fig, axes = plt.subplots(7, 7, figsize=(10, 10), sharey="all")

idx = 637
for _, ax in enumerate(axes.flat):

    if idx >= 671:
        break

    hist(streamflow.iloc[:, idx].values.reshape(-1,),
     bins=20,
     ax=ax,
     show=False
    )

    idx += 1

plt.show()
print(idx)
671
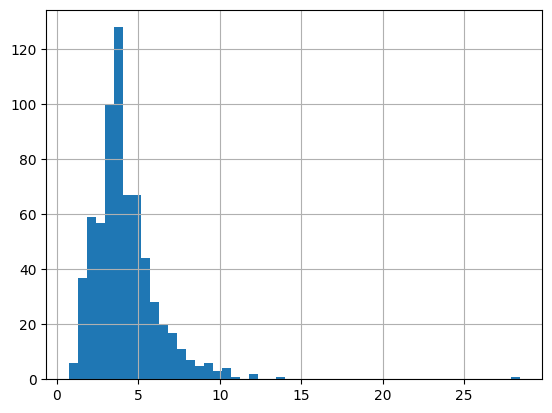
[45]:
# skewness of streamflow

_ = hist(streamflow.skew().values.reshape(-1,), bins=50)
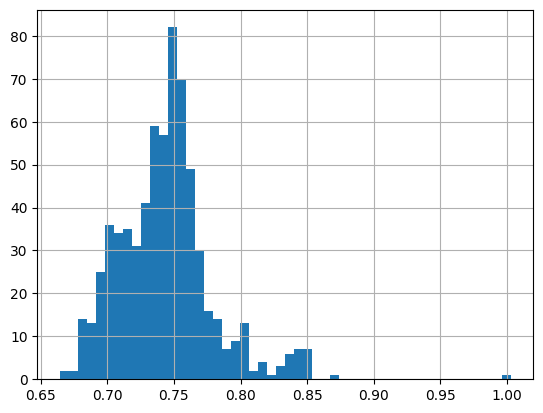
potential evapotranspiration
[42]:
pet = dataset.fetch(dynamic_features = 'pet', as_dataframe=True)
pet = pet.reset_index()
pet.index = pd.to_datetime(pet.pop('time'))
pet.pop('dynamic_features')
print(pet.shape)
EDA(data=pet, save=False).heatmap()
(16436, 671)

[42]:
<AxesSubplot: ylabel='Examples'>
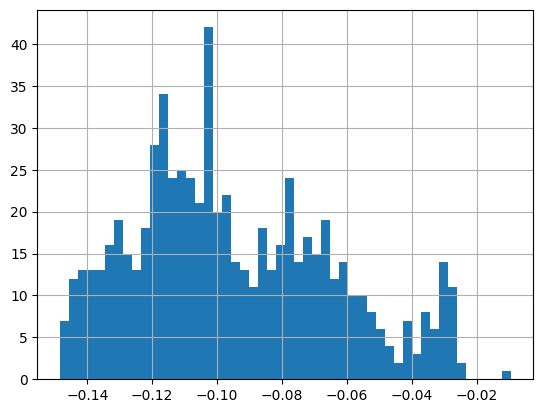
[43]:
_ = hist(pet.skew().values.reshape(-1,), bins=50)
Air Temperature
[44]:
temp = dataset.fetch(dynamic_features = 'temperature', as_dataframe=True)
temp = temp.reset_index()
temp.index = pd.to_datetime(temp.pop('time'))
temp.pop('dynamic_features')

print(temp.shape)

EDA(data=temp, save=False).heatmap()
(16436, 671)

[44]:
<AxesSubplot: ylabel='Examples'>
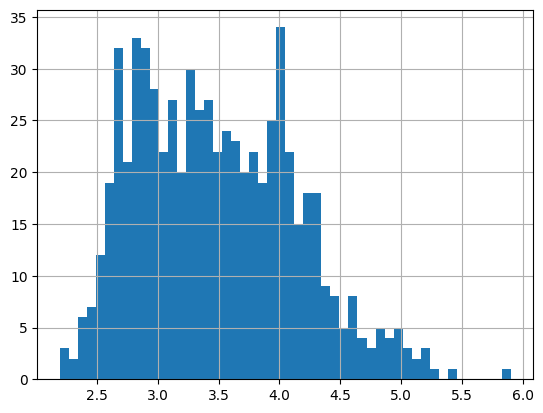
[45]:
_ = hist(temp.skew().values.reshape(-1,), bins=50)
Precipitation
[46]:
pcp = dataset.fetch(dynamic_features = 'precipitation', as_dataframe=True)
pcp = pcp.reset_index()
pcp.index = pd.to_datetime(pcp.pop('time'))
pcp.pop('dynamic_features')
print(pcp.shape)
EDA(data=pcp, save=False).heatmap()
(16436, 671)

[46]:
<AxesSubplot: ylabel='Examples'>
[47]:
_ = hist(pcp.skew().values.reshape(-1,), bins=50)
[69]: