CAMELS Brazil
![]()
![]()
This notebook explores CAMELS Brazil dataset which was introduced in VP Changas et al., 2020.
[1]:
from ai4water.eda import EDA
from ai4water.datasets import CAMELS_BR
from ai4water.utils.utils import get_version_info

import pandas as pd
import numpy as np

import matplotlib.pyplot as plt

from easy_mpl import hist, ridge
from easy_mpl import scatter
from easy_mpl.utils import process_cbar
**********Tensorflow models could not be imported **********
C:\Users\ather\.conda\envs\cat_aware\lib\site-packages\sklearn\experimental\enable_hist_gradient_boosting.py:15: UserWarning: Since version 1.0, it is not needed to import enable_hist_gradient_boosting anymore. HistGradientBoostingClassifier and HistGradientBoostingRegressor are now stable and can be normally imported from sklearn.ensemble.
  warnings.warn(
[2]:
for k,v in get_version_info().items():
    print(k, v)
python 3.8.17 (default, Jul  5 2023, 20:44:21) [MSC v.1916 64 bit (AMD64)]
os nt
ai4water 1.07
easy_mpl 0.21.3
SeqMetrics 1.3.4
numpy 1.24.3
pandas 1.3.4
matplotlib 3.6.0
sklearn 1.3.0
xarray 0.20.1
netCDF4 1.5.7
seaborn 0.12.2
[3]:
dataset = CAMELS_BR(
    path=r"E:\data\gscad\CAMELS\CAMELS_BR"   # set path to None if you have not already downloaded data
)
    Not downloading the data since the directory
    E:\data\gscad\CAMELS\CAMELS_BR already exists.
    Use overwrite=True to remove previously saved files and download again
[4]:
dataset.start
[4]:
'19800101'
[5]:
dataset.end
[5]:
'20181231'
[6]:
stations = dataset.stations()
len(stations)
[6]:
593
Static Data
[7]:
dataset.static_features
[7]:
['p_mean',
 'pet_mean',
 'et_mean',
 'aridity',
 'p_seasonality',
 'asynchronicity',
 'frac_snow',
 'high_prec_freq',
 'high_prec_dur',
 'high_prec_timing',
 'low_prec_freq',
 'low_prec_dur',
 'low_prec_timing',
 'geol_class_1st',
 'geol_class_1st_perc',
 'geol_class_2nd',
 'geol_class_2nd_perc',
 'carb_rocks_perc',
 'geol_porosity',
 'geol_permeability',
 'consumptive_use',
 'consumptive_use_perc',
 'reservoirs_vol',
 'regulation_degree',
 'q_mean',
 'runoff_ratio',
 'stream_elas',
 'slope_fdc',
 'baseflow_index',
 'hfd_mean',
 'Q5',
 'Q95',
 'high_q_freq',
 'high_q_dur',
 'low_q_freq',
 'low_q_dur',
 'zero_q_freq',
 'crop_perc',
 'crop_mosaic_perc',
 'forest_perc',
 'shrub_perc',
 'grass_perc',
 'barren_perc',
 'imperv_perc',
 'wet_perc',
 'snow_perc',
 'dom_land_cover',
 'dom_land_cover_perc',
 'gauge_name',
 'gauge_region',
 'gauge_lat',
 'gauge_lon',
 'area_ana',
 'area_gsim',
 'area_gsim_quality',
 'q_quality_control_perc',
 'q_stream_stage_perc',
 'sand_perc',
 'silt_perc',
 'clay_perc',
 'org_carbon_content',
 'bedrock_depth',
 'water_table_depth',
 'elev_gauge',
 'elev_mean',
 'slope_mean',
 'area']
[8]:
hfd = ''
[9]:
static = dataset.fetch_static_features(stn_id=stations)
static.shape
[9]:
(593, 67)
[10]:
EDA(data=static, save=False).heatmap()
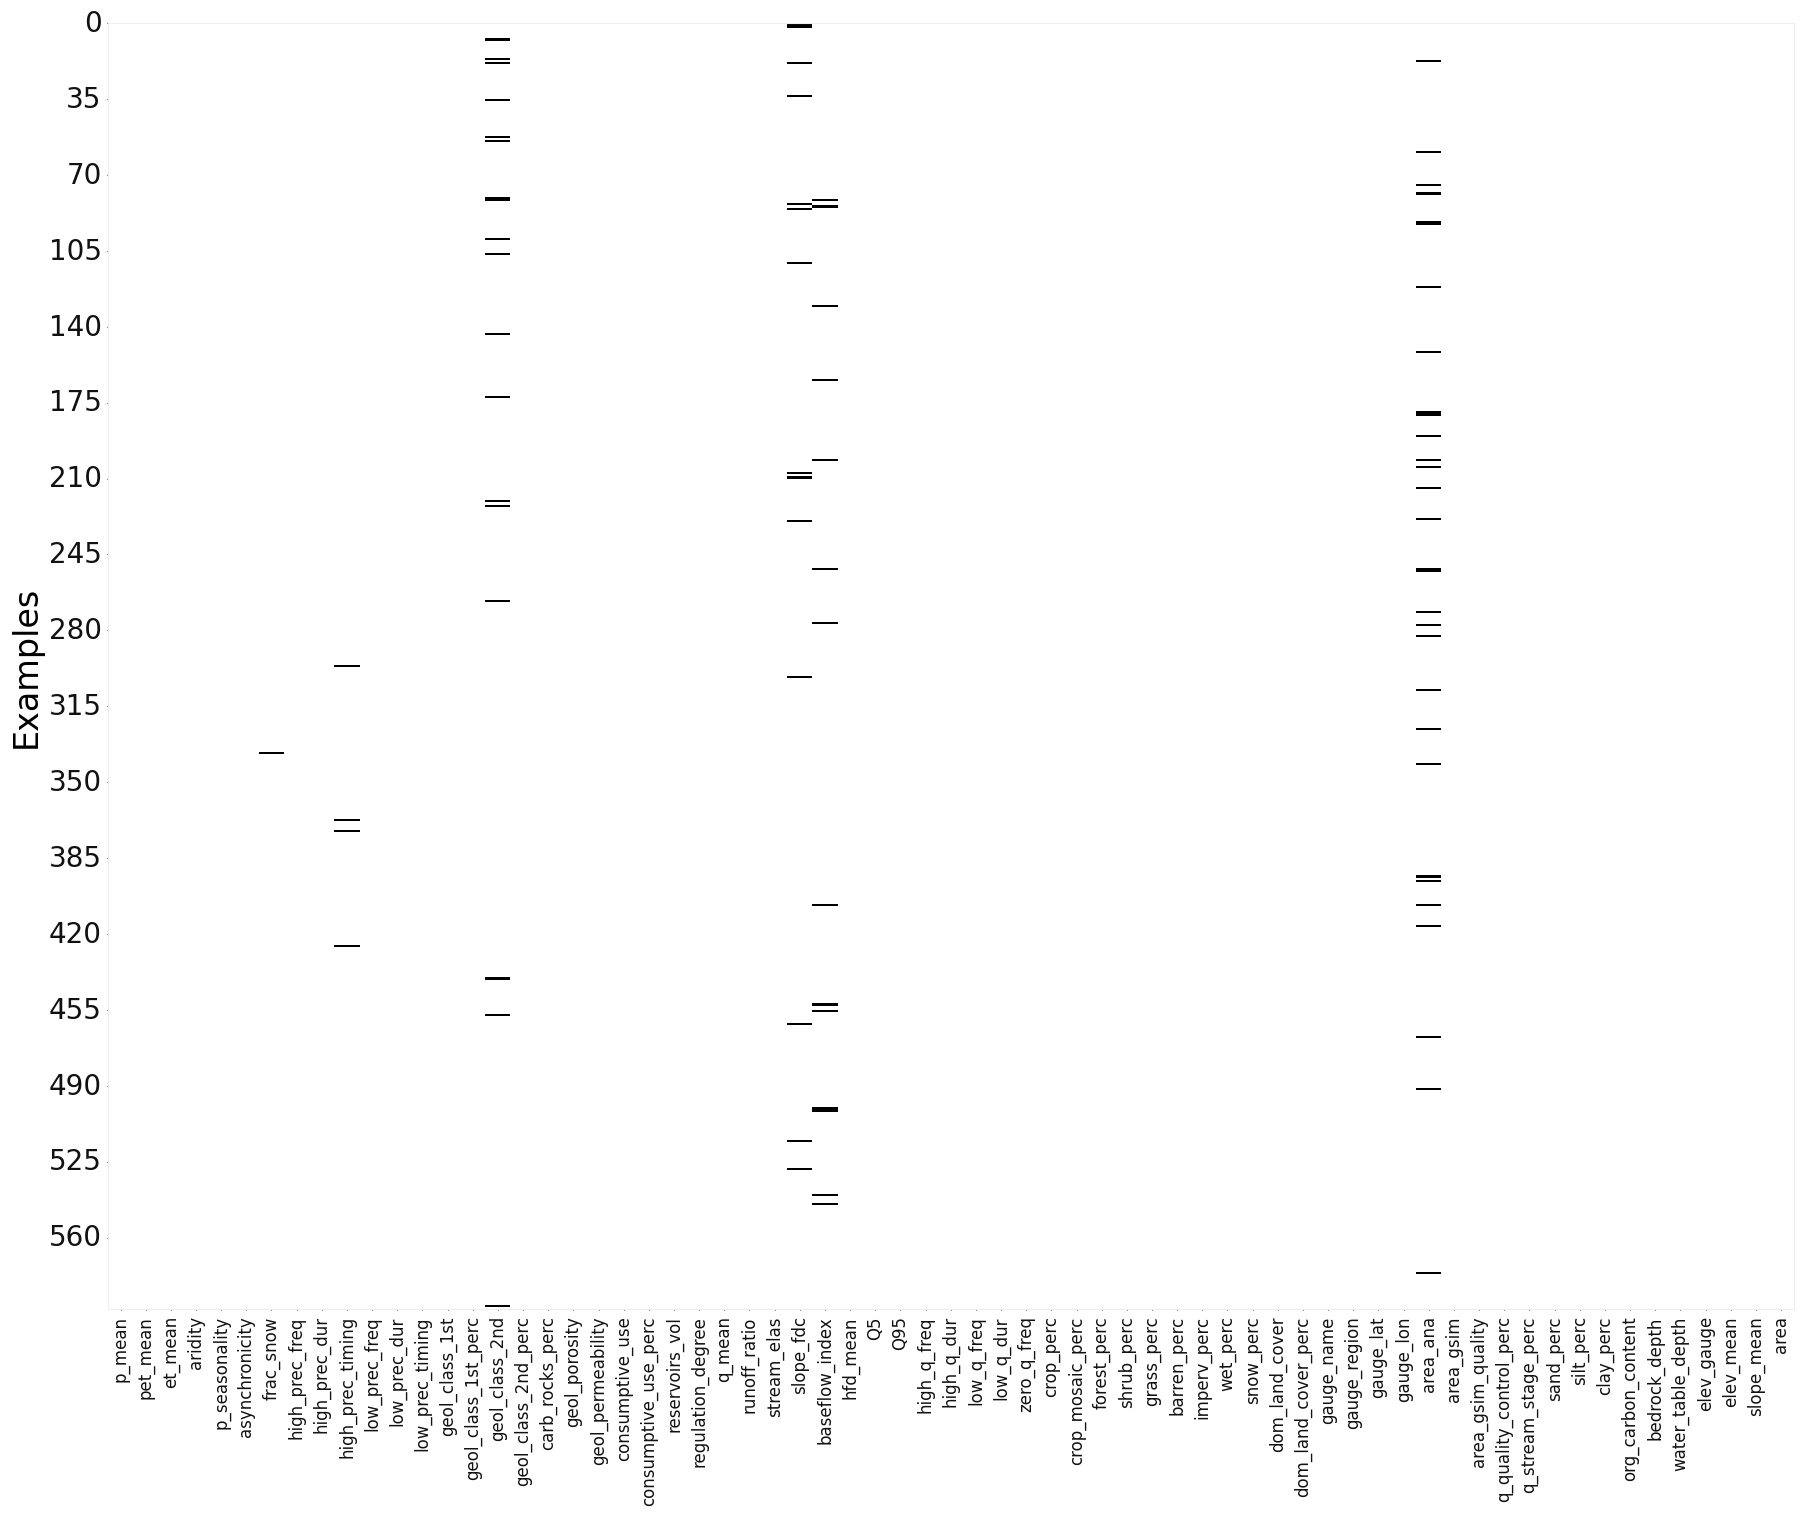
[10]:
<AxesSubplot: ylabel='Examples'>
[11]:
static = static.dropna(axis=1)
static.shape
[11]:
(593, 61)
[13]:
coords = dataset.stn_coords()
coords
[13]:
| lat | long | |
|---|---|---|
| gauge_id | ||
| 36020000 | -6.3244 | -40.1617 |
| 36045000 | -6.6461 | -39.9617 |
| 87270000 | -29.7011 | -51.4411 |
| 29100000 | -5.4867 | -49.2214 |
| 84071000 | -27.4142 | -48.9528 |
| ... | ... | ... |
| 26350000 | -11.6181 | -50.6625 |
| 50380000 | -10.8450 | -40.1128 |
| 26720000 | -12.4178 | -49.5892 |
| 74700000 | -27.6742 | -54.4625 |
| 45880000 | -13.5586 | -44.3031 |
593 rows × 2 columns
[14]:
dataset.plot_stations()
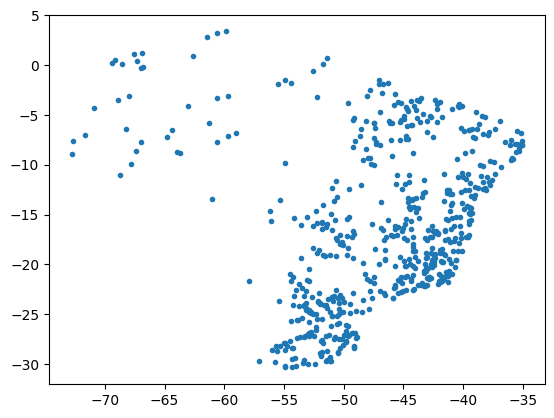
[14]:
<AxesSubplot: >
[15]:
[16]:
idx = 0
ax_num = 0

fig, axes = plt.subplots(5, 5, figsize=(15, 12))
axes = axes.flatten()

while ax_num < 25 and idx<static.shape[1]:

    val = static.iloc[:, idx]
    idx += 1

    try:
        c = val.astype(float).values.reshape(-1,)

        en = static.shape[0]
        ax = axes[ax_num]
        ax, sc = scatter(long[0:en], lat[0:en], c=c[0:en], cmap="hot", show=False, ax=ax)

        process_cbar(ax, sc, border=False, title=val.name, #title_kws ={"fontsize": 14}
                    )
        ax_num += 1
    except ValueError:
        continue


plt.tight_layout()
plt.show()
print(idx)
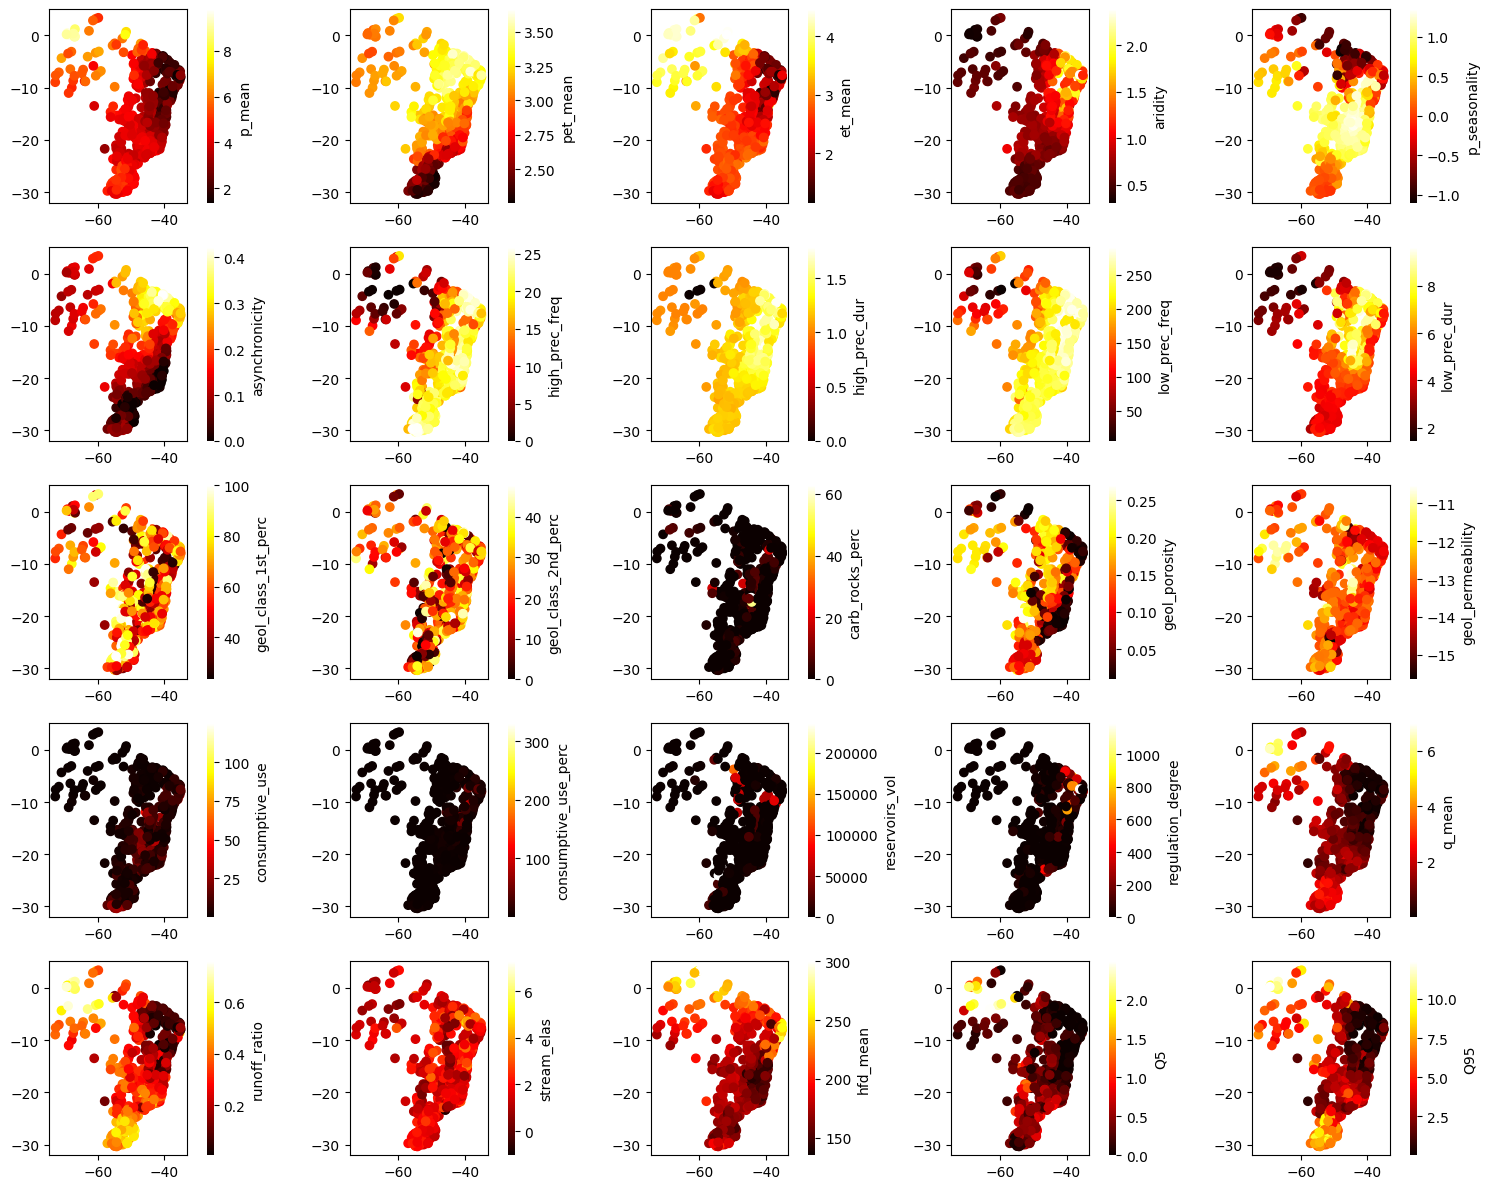
27
[17]:
idx = 27
ax_num = 0

fig, axes = plt.subplots(5, 5, figsize=(15, 12))
axes = axes.flatten()

while ax_num < 25 and idx<static.shape[1]:

    val = static.iloc[:, idx]
    idx += 1

    try:
        c = val.astype(float).values.reshape(-1,)

        en = static.shape[0]
        ax = axes[ax_num]
        ax, sc = scatter(long[0:en], lat[0:en], c=c[0:en], cmap="hot", show=False, ax=ax)

        process_cbar(ax, sc, border=False, title=val.name, #title_kws ={"fontsize": 14}
                    )
        ax_num += 1
    except ValueError:
        continue


plt.tight_layout()
plt.show()
print(idx)
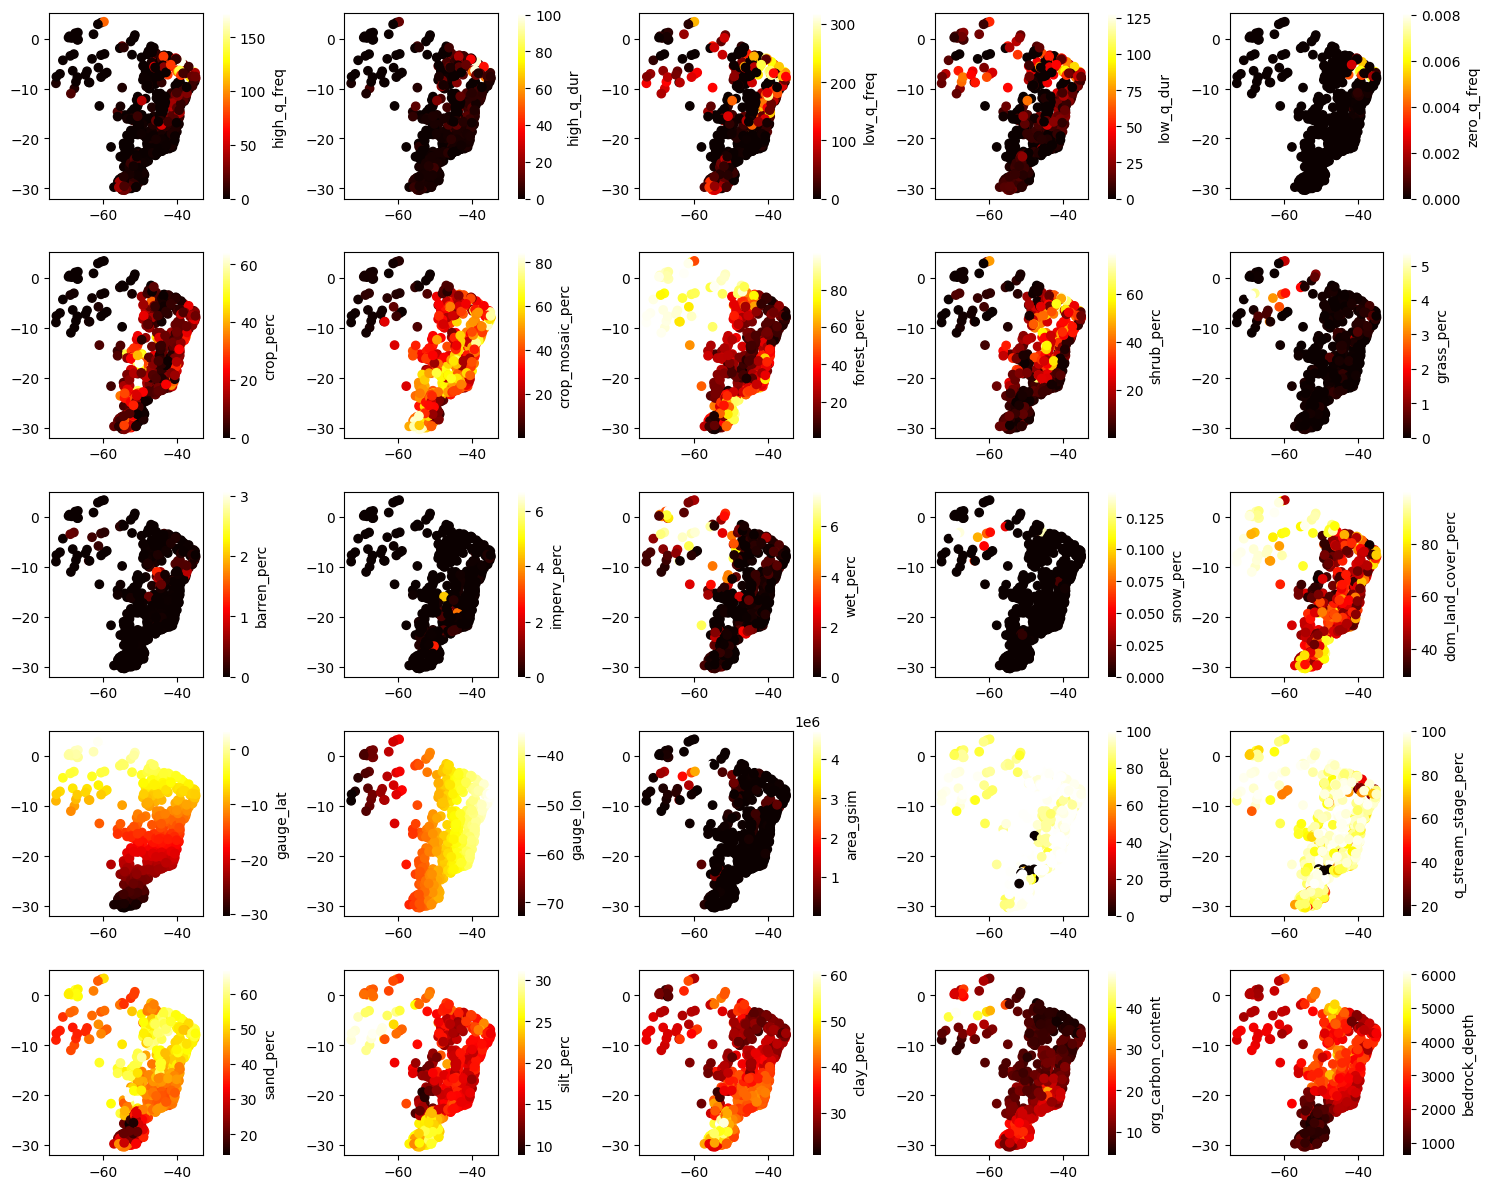
56
[18]:
idx = 56
ax_num = 0

fig, axes = plt.subplots(5, 5, figsize=(15, 12))
axes = axes.flatten()

while ax_num < 25 and idx<static.shape[1]:

    val = static.iloc[:, idx]
    idx += 1

    try:
        c = val.astype(float).values.reshape(-1,)

        en = static.shape[0]
        ax = axes[ax_num]
        ax, sc = scatter(long[0:en], lat[0:en], c=c[0:en], cmap="hot", show=False, ax=ax)

        process_cbar(ax, sc, border=False, title=val.name, #title_kws ={"fontsize": 14}
                    )
        ax_num += 1
    except ValueError:
        continue


plt.tight_layout()
plt.show()
print(idx)
61
Dynamic Features
[19]:
dataset.dynamic_features
[19]:
['streamflow_m3s',
 'streamflow_mm',
 'simulated_streamflow_m3s',
 'precipitation_cpc',
 'precipitation_mswep',
 'precipitation_chirps',
 'evapotransp_gleam',
 'evapotransp_mgb',
 'potential_evapotransp_gleam',
 'temperature_min',
 'temperature_mean',
 'temperature_max']
[20]:
# difference betwen different pcp ???
# meaning of gleam ???
Streamflow
[22]:
streamflow = dataset.q_mmd()
print(streamflow.shape)
(14245, 593)
[23]:
EDA(data=streamflow, save=False).heatmap()
[23]:
<AxesSubplot: ylabel='Examples'>
[24]:
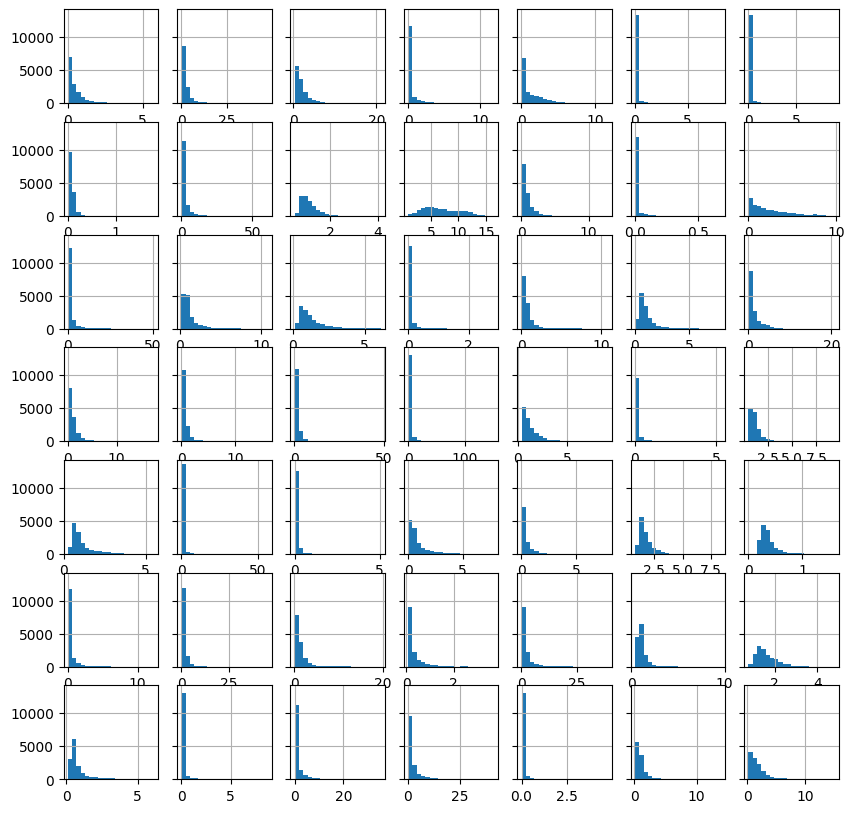
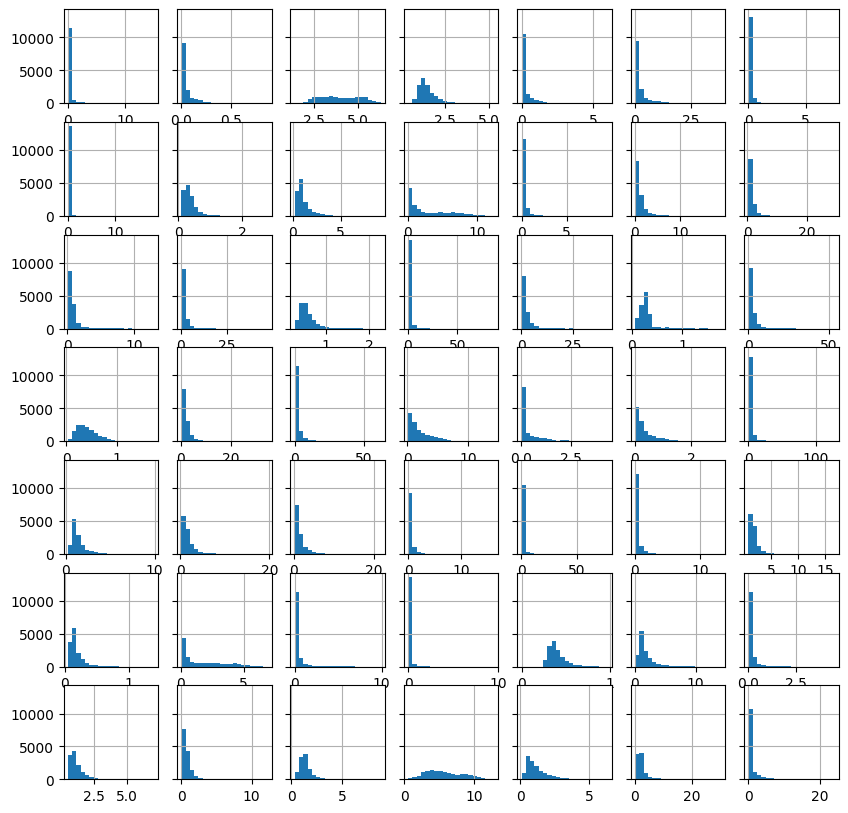
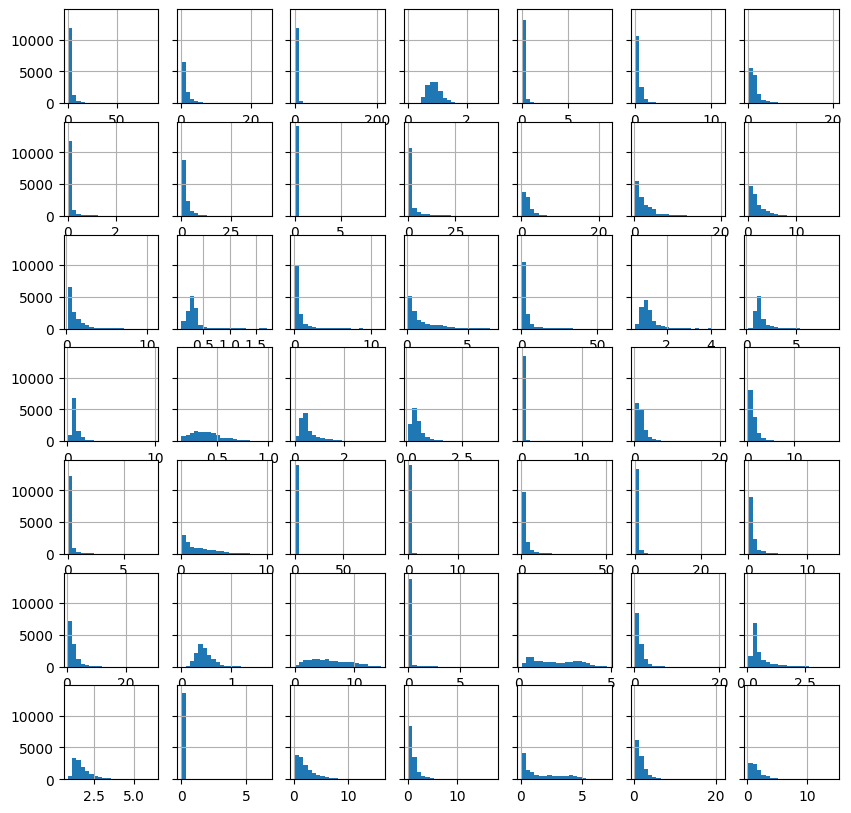
st = 0

fig, axes = plt.subplots(7, 7, figsize=(10, 10), sharey="all")

idx = st
for _, ax in enumerate(axes.flat):

    hist(streamflow.iloc[:, idx].values.reshape(-1,),
         bins=20,
         ax=ax,
         show=False
        )

    idx += 1

plt.show()
print(idx)
49
[25]:
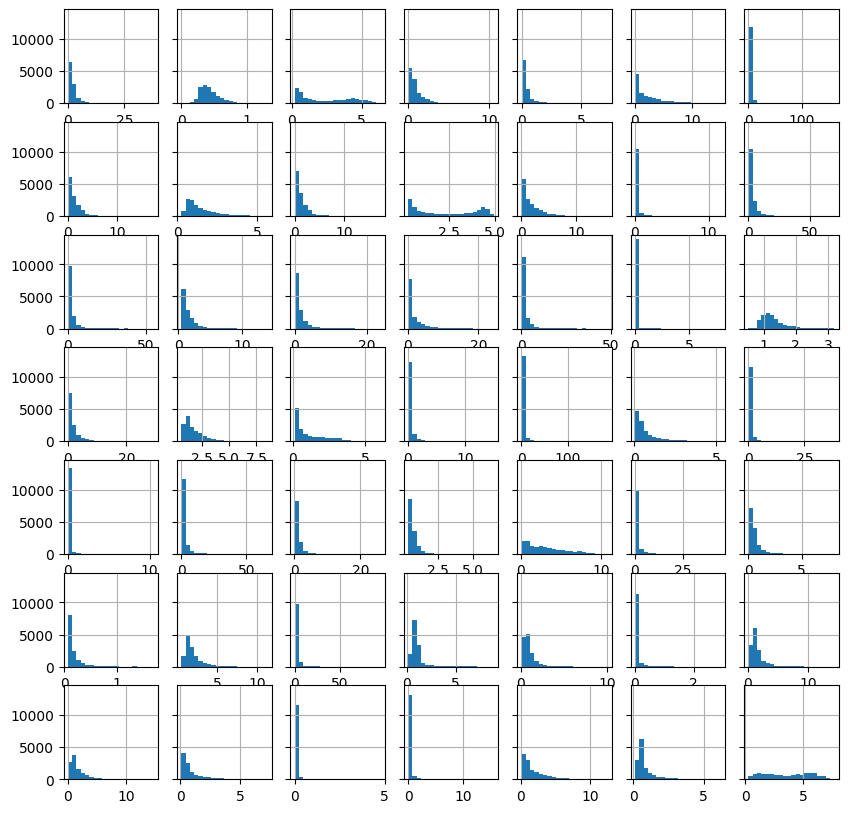
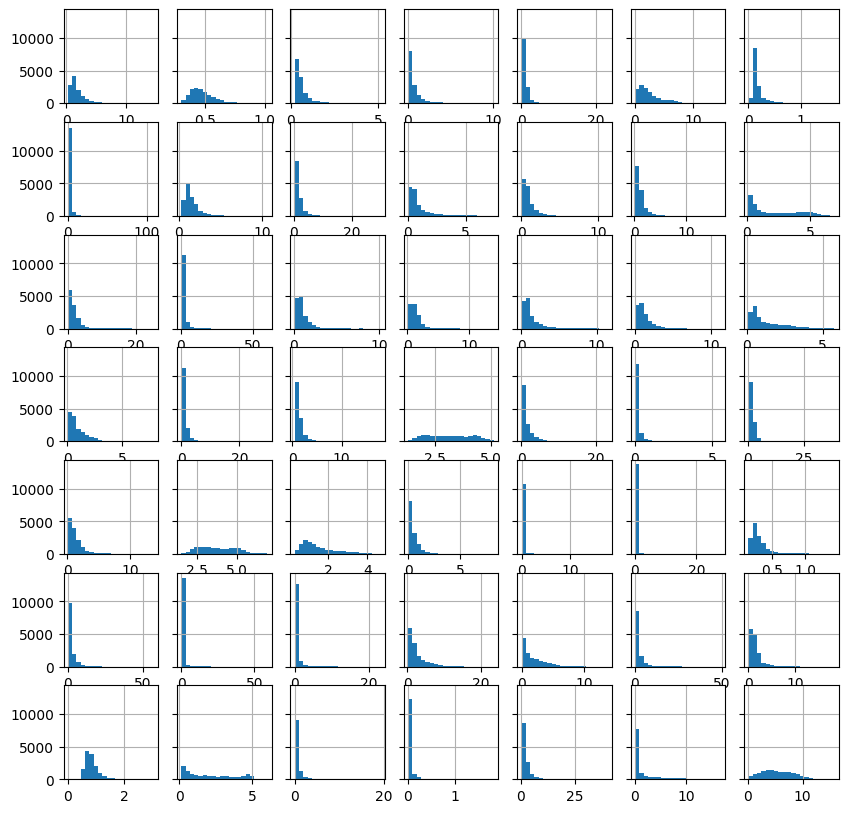
st = 49

fig, axes = plt.subplots(7, 7, figsize=(10, 10), sharey="all")

idx = st
for _, ax in enumerate(axes.flat):

    hist(streamflow.iloc[:, idx].values.reshape(-1,),
         bins=20,
         ax=ax,
         show=False
        )

    idx += 1

plt.show()
print(idx)
98
[26]:
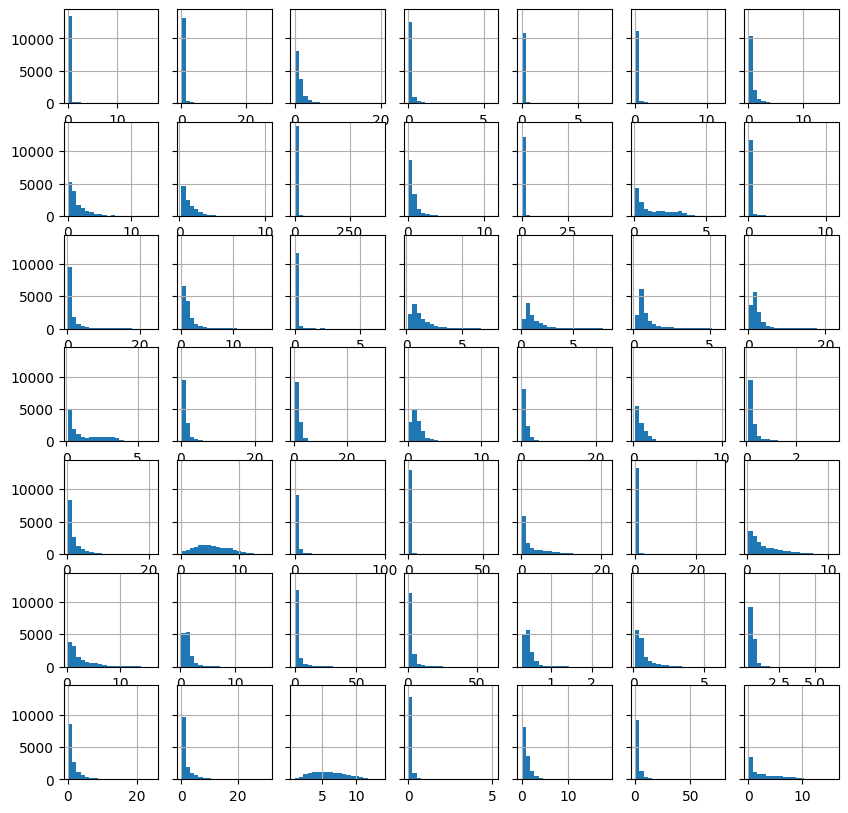
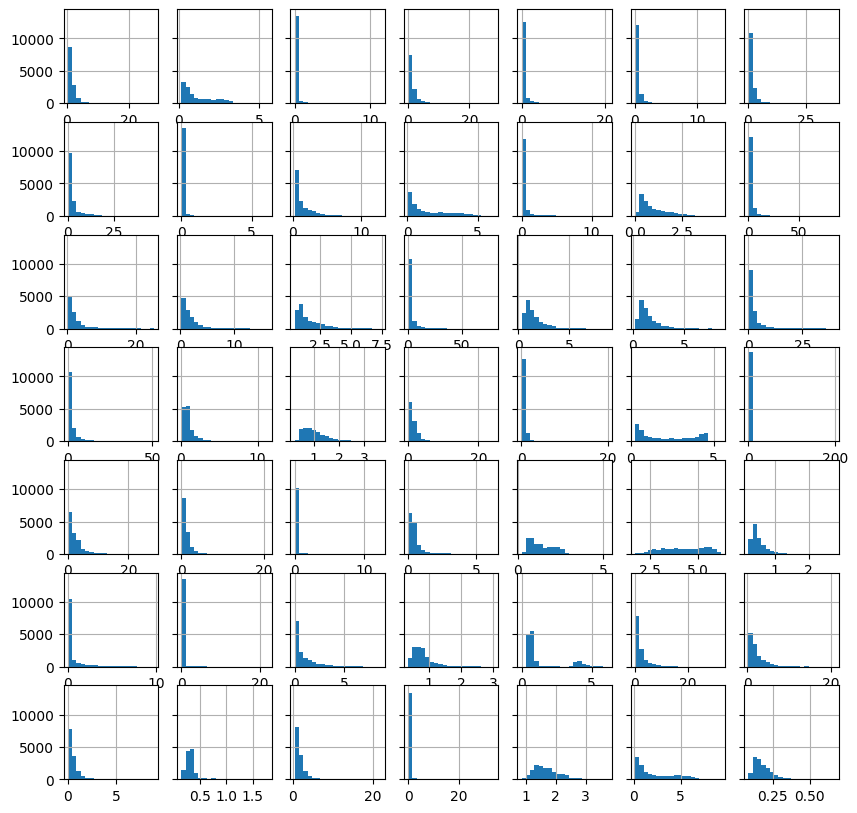
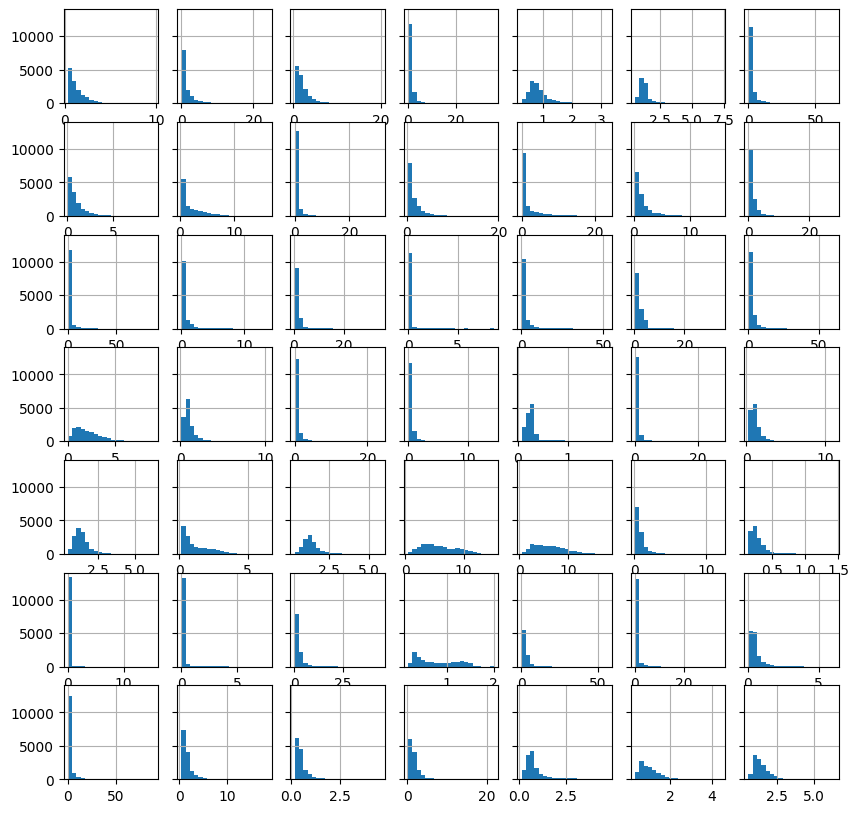
st = 98

fig, axes = plt.subplots(7, 7, figsize=(10, 10), sharey="all")

idx = st
for _, ax in enumerate(axes.flat):

    hist(streamflow.iloc[:, idx].values.reshape(-1,),
         bins=20,
         ax=ax,
         show=False
        )

    idx += 1

plt.show()
print(idx)
147
[27]:
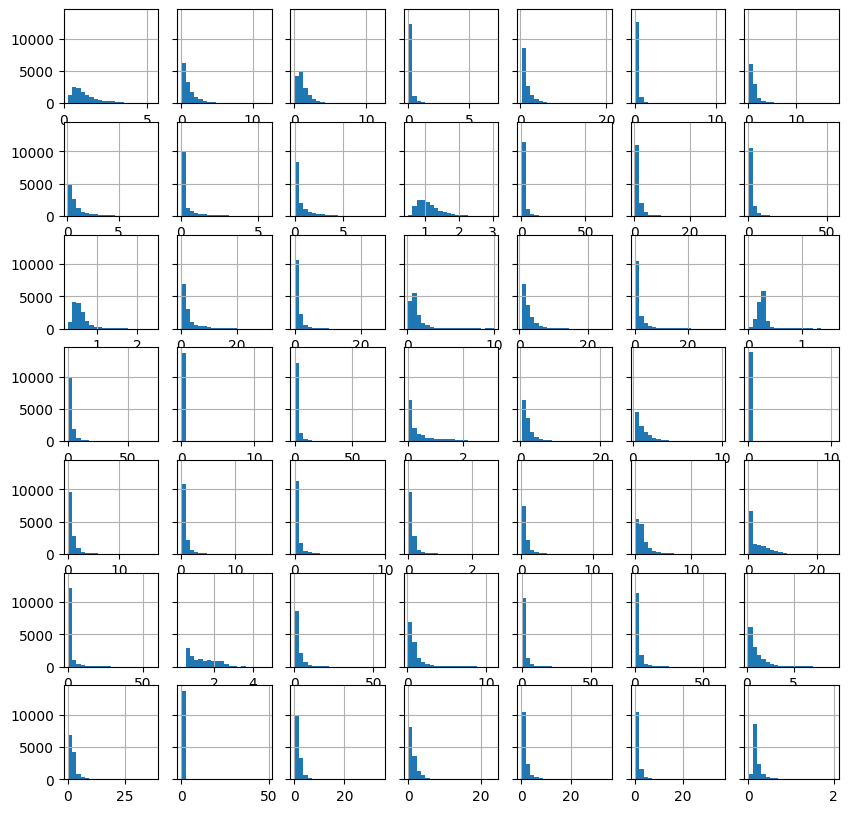
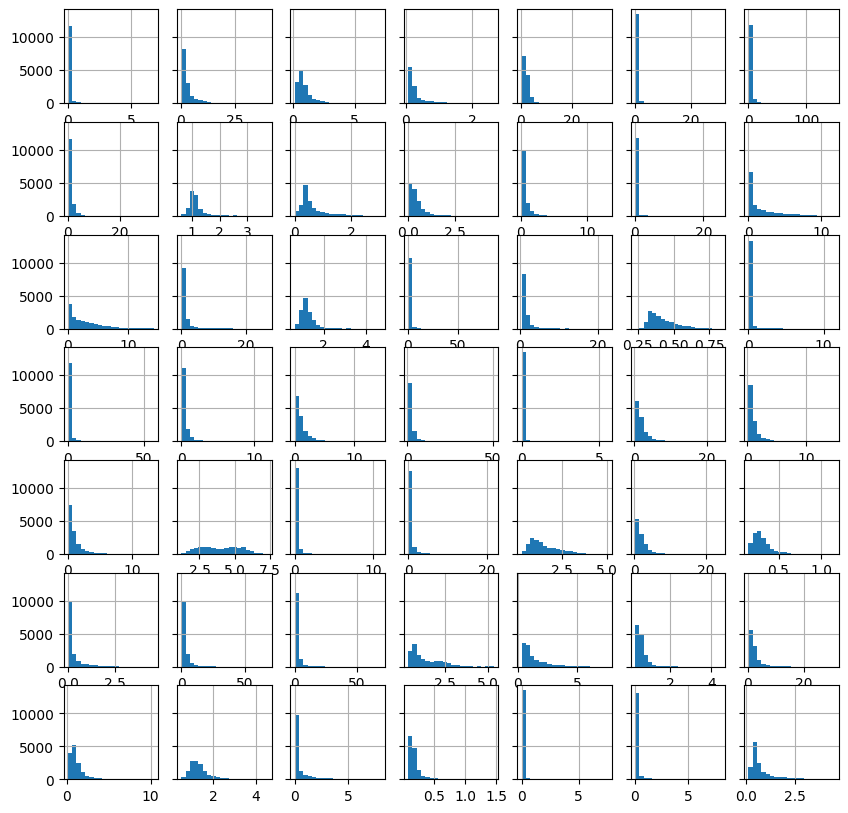
st = 147

fig, axes = plt.subplots(7, 7, figsize=(10, 10), sharey="all")

idx = st
for _, ax in enumerate(axes.flat):

    hist(streamflow.iloc[:, idx].values.reshape(-1,),
         bins=20,
         ax=ax,
         show=False
        )

    idx += 1

plt.show()
print(idx)
196
[28]:
st = 196

fig, axes = plt.subplots(7, 7, figsize=(10, 10), sharey="all")

idx = st
for _, ax in enumerate(axes.flat):


    hist(streamflow.iloc[:, idx].values.reshape(-1,),
     bins=20,
     ax=ax,
     show=False
    )

    idx += 1

plt.show()
print(idx)
245
[29]:
st = 245

fig, axes = plt.subplots(7, 7, figsize=(10, 10), sharey="all")

idx = st
for _, ax in enumerate(axes.flat):


    hist(streamflow.iloc[:, idx].values.reshape(-1,),
     bins=20,
     ax=ax,
     show=False
    )

    idx += 1

plt.show()
print(idx)
294
[30]:
st = 294

fig, axes = plt.subplots(7, 7, figsize=(10, 10), sharey="all")

idx = st
for _, ax in enumerate(axes.flat):


    hist(streamflow.iloc[:, idx].values.reshape(-1,),
     bins=20,
     ax=ax,
     show=False
    )

    idx += 1

plt.show()
print(idx)
343
[31]:
st = 343

fig, axes = plt.subplots(7, 7, figsize=(10, 10), sharey="all")

idx = st
for _, ax in enumerate(axes.flat):


    hist(streamflow.iloc[:, idx].values.reshape(-1,),
     bins=20,
     ax=ax,
     show=False
    )

    idx += 1

plt.show()
print(idx)
392
[32]:
st = 392

fig, axes = plt.subplots(7, 7, figsize=(10, 10), sharey="all")

idx = st
for _, ax in enumerate(axes.flat):


    hist(streamflow.iloc[:, idx].values.reshape(-1,),
     bins=20,
     ax=ax,
     show=False
    )

    idx += 1

plt.show()
print(idx)
441
[33]:
st = 441

fig, axes = plt.subplots(7, 7, figsize=(10, 10), sharey="all")

idx = st
for _, ax in enumerate(axes.flat):


    hist(streamflow.iloc[:, idx].values.reshape(-1,),
     bins=20,
     ax=ax,
     show=False
    )

    idx += 1

plt.show()
print(idx)
490
[34]:
st = 490

fig, axes = plt.subplots(7, 7, figsize=(10, 10), sharey="all")

idx = st
for _, ax in enumerate(axes.flat):


    hist(streamflow.iloc[:, idx].values.reshape(-1,),
     bins=20,
     ax=ax,
     show=False
    )

    idx += 1

plt.show()
print(idx)
539
[35]:
st = 539

fig, axes = plt.subplots(7, 7, figsize=(10, 10), sharey="all")

idx = st
for _, ax in enumerate(axes.flat):


    hist(streamflow.iloc[:, idx].values.reshape(-1,),
     bins=20,
     ax=ax,
     show=False
    )

    idx += 1

plt.show()
print(idx)
588
[36]:
fig, axes = plt.subplots(7, 7, figsize=(10, 10), sharey="all")

idx = 588
for _, ax in enumerate(axes.flat):

    if idx>=593:
        break

    hist(streamflow.iloc[:, idx].values.reshape(-1,),
     bins=20,
     ax=ax,
     show=False
    )

    idx += 1

plt.show()
print(idx)
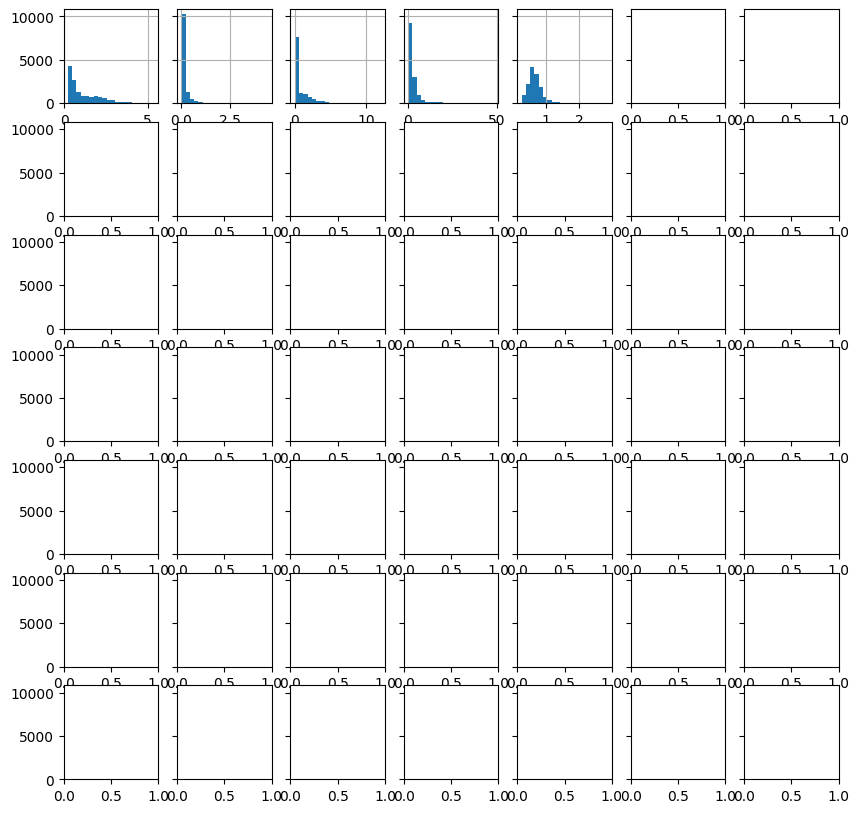
593
[37]:
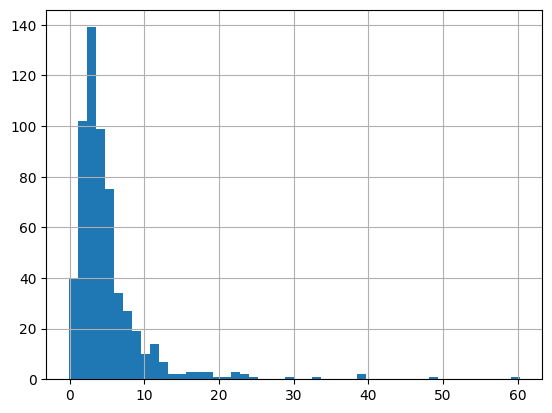
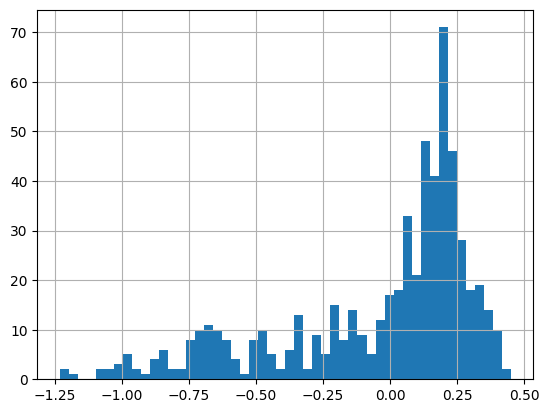
# skewness of streamflow

_ = hist(streamflow.skew().values.reshape(-1,), bins=50)
potential evapotranspiration
[38]:
pet = dataset.fetch(dynamic_features = 'potential_evapotransp_gleam', as_dataframe=True)
pet = pet.reset_index()
pet.index = pd.to_datetime(pet.pop('time'))
pet.pop('dynamic_features')
print(pet.shape)
EDA(data=pet, save=False).heatmap()
(14245, 593)

[38]:
<AxesSubplot: ylabel='Examples'>
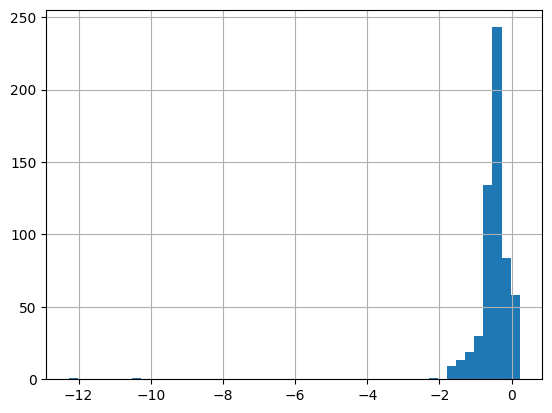
[39]:
_ = hist(pet.skew().values.reshape(-1,), bins=50)
Air Temperature
[40]:
temp = dataset.fetch(dynamic_features = 'temperature_mean', as_dataframe=True)
temp = temp.reset_index()
temp.index = pd.to_datetime(temp.pop('time'))
temp.pop('dynamic_features')

print(temp.shape)

EDA(data=temp, save=False).heatmap()
(14245, 593)

[40]:
<AxesSubplot: ylabel='Examples'>
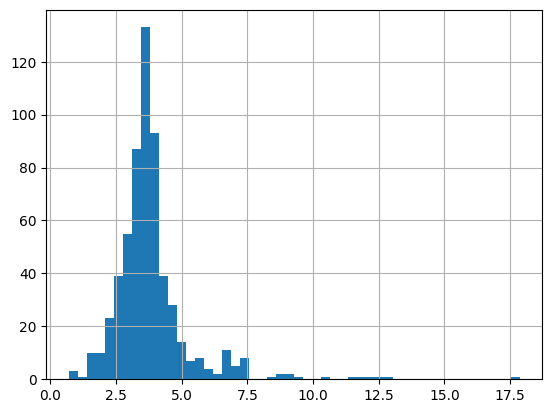
[41]:
_ = hist(temp.skew().values.reshape(-1,), bins=50)
Precipitation
[4]:
pcp = dataset.fetch(dynamic_features = 'precipitation_mswep', as_dataframe=True)
pcp = pcp.reset_index()
pcp.index = pd.to_datetime(pcp.pop('time'))
pcp.pop('dynamic_features')
print(pcp.shape)
EDA(data=pcp, save=False).heatmap()
(14245, 593)

[4]:
<AxesSubplot: ylabel='Examples'>
[5]:
_ = hist(pcp.skew().values.reshape(-1,), bins=50)
[ ]: