CAMELS Australia
![]()
![]()
This notebook explores CAMELS Australia dataset which was introduced in Fowler et al., 2020.
[1]:
import pandas as pd
import numpy as np

from ai4water.datasets import CAMELS_AUS
from ai4water.utils.utils import get_version_info
from ai4water.eda import EDA

import matplotlib.pyplot as plt

from easy_mpl import hist, ridge, scatter
from easy_mpl.utils import process_cbar
**********Tensorflow models could not be imported **********
C:\Users\ather\.conda\envs\cat_aware\lib\site-packages\sklearn\experimental\enable_hist_gradient_boosting.py:15: UserWarning: Since version 1.0, it is not needed to import enable_hist_gradient_boosting anymore. HistGradientBoostingClassifier and HistGradientBoostingRegressor are now stable and can be normally imported from sklearn.ensemble.
  warnings.warn(
[2]:
for k,v in get_version_info().items():
    print(k, v)
python 3.8.17 (default, Jul  5 2023, 20:44:21) [MSC v.1916 64 bit (AMD64)]
os nt
ai4water 1.07
easy_mpl 0.21.3
SeqMetrics 1.3.4
numpy 1.24.3
pandas 1.3.4
matplotlib 3.6.0
sklearn 1.3.0
xarray 0.20.1
netCDF4 1.5.7
seaborn 0.12.2
[4]:
dataset = CAMELS_AUS(
    path=r"E:\data\gscad\CAMELS\CAMELS_AUS"  # set path to None if you have not already downloaded data
)
[5]:
dataset.start
[5]:
'19570101'
[6]:
dataset.end
[6]:
'20181231'
[7]:
stations = dataset.stations()
len(stations)
[7]:
222
Static Features
[8]:
dataset.static_features
[8]:
['station_name',
 'drainage_division',
 'river_region',
 'notes',
 'lat_outlet',
 'long_outlet',
 'lat_centroid',
 'long_centroid',
 'map_zone',
 'catchment_area',
 'nested_status',
 'next_station_ds',
 'num_nested_within',
 'start_date',
 'end_date',
 'prop_missing_data',
 'q_uncert_num_curves',
 'q_uncert_n',
 'q_uncert_q10',
 'q_uncert_q10_upper',
 'q_uncert_q10_lower',
 'q_uncert_q50',
 'q_uncert_q50_upper',
 'q_uncert_q50_lower',
 'q_uncert_q90',
 'q_uncert_q90_upper',
 'q_uncert_q90_lower',
 'p_mean',
 'pet_mean',
 'aridity',
 'p_seasonality',
 'frac_snow',
 'high_prec_freq',
 'high_prec_dur',
 'high_prec_timing',
 'low_prec_freq',
 'low_prec_dur',
 'low_prec_timing',
 'q_mean',
 'runoff_ratio',
 'stream_elas',
 'slope_fdc',
 'baseflow_index',
 'hdf_mean',
 'Q5',
 'Q95',
 'high_q_freq',
 'high_q_dur',
 'low_q_freq',
 'low_q_dur',
 'zero_q_freq',
 'geol_prim',
 'geol_prim_prop',
 'geol_sec',
 'geol_sec_prop',
 'unconsoldted',
 'igneous',
 'silicsed',
 'carbnatesed',
 'othersed',
 'metamorph',
 'sedvolc',
 'oldrock',
 'claya',
 'clayb',
 'sanda',
 'solum_thickness',
 'ksat',
 'solpawhc',
 'elev_min',
 'elev_max',
 'elev_mean',
 'elev_range',
 'mean_slope_pct',
 'upsdist',
 'strdensity',
 'strahler',
 'elongratio',
 'relief',
 'reliefratio',
 'mrvbf_prop_0',
 'mrvbf_prop_1',
 'mrvbf_prop_2',
 'mrvbf_prop_3',
 'mrvbf_prop_4',
 'mrvbf_prop_5',
 'mrvbf_prop_6',
 'mrvbf_prop_7',
 'mrvbf_prop_8',
 'mrvbf_prop_9',
 'confinement',
 'lc01_extracti',
 'lc03_waterbo',
 'lc04_saltlak',
 'lc05_irrcrop',
 'lc06_irrpast',
 'lc07_irrsuga',
 'lc08_rfcropp',
 'lc09_rfpastu',
 'lc10_rfsugar',
 'lc11_wetlands',
 'lc14_tussclo',
 'lc15_alpineg',
 'lc16_openhum',
 'lc18_opentus',
 'lc19_shrbsca',
 'lc24_shrbden',
 'lc25_shrbope',
 'lc31_forclos',
 'lc32_foropen',
 'lc33_woodope',
 'lc34_woodspa',
 'lc35_urbanar',
 'prop_forested',
 'nvis_grasses_n',
 'nvis_grasses_e',
 'nvis_forests_n',
 'nvis_forests_e',
 'nvis_shrubs_n',
 'nvis_shrubs_e',
 'nvis_woodlands_n',
 'nvis_woodlands_e',
 'nvis_bare_n',
 'nvis_bare_e',
 'nvis_nodata_n',
 'nvis_nodata_e',
 'distupdamw',
 'impound_fac',
 'flow_div_fac',
 'leveebank_fac',
 'infrastruc_fac',
 'settlement_fac',
 'extract_ind_fac',
 'landuse_fac',
 'catchment_di',
 'flow_regime_di',
 'river_di',
 'pop_mean',
 'pop_max',
 'pop_gt_1',
 'pop_gt_10',
 'erosivity',
 'anngro_mega',
 'anngro_meso',
 'anngro_micro',
 'gromega_seas',
 'gromeso_seas',
 'gromicro_seas',
 'npp_ann',
 'npp_1',
 'npp_2',
 'npp_3',
 'npp_4',
 'npp_5',
 'npp_6',
 'npp_7',
 'npp_8',
 'npp_9',
 'npp_10',
 'npp_11',
 'npp_12']
[9]:
mrvbf = 'proportion of catchment occupied by classes of MultiResolution Valley Bottom Flatness'
lc01 = 'land cover codes'
nvis = 'vegetation sub-groups'
anngro = 'Average annual growth index value for some plants'
gromega = 'Seasonality of growth index value'
npp = 'net primary productivity'
[10]:
static = dataset.fetch_static_features(stn_id=stations)
static.shape
[10]:
(222, 161)
[11]:
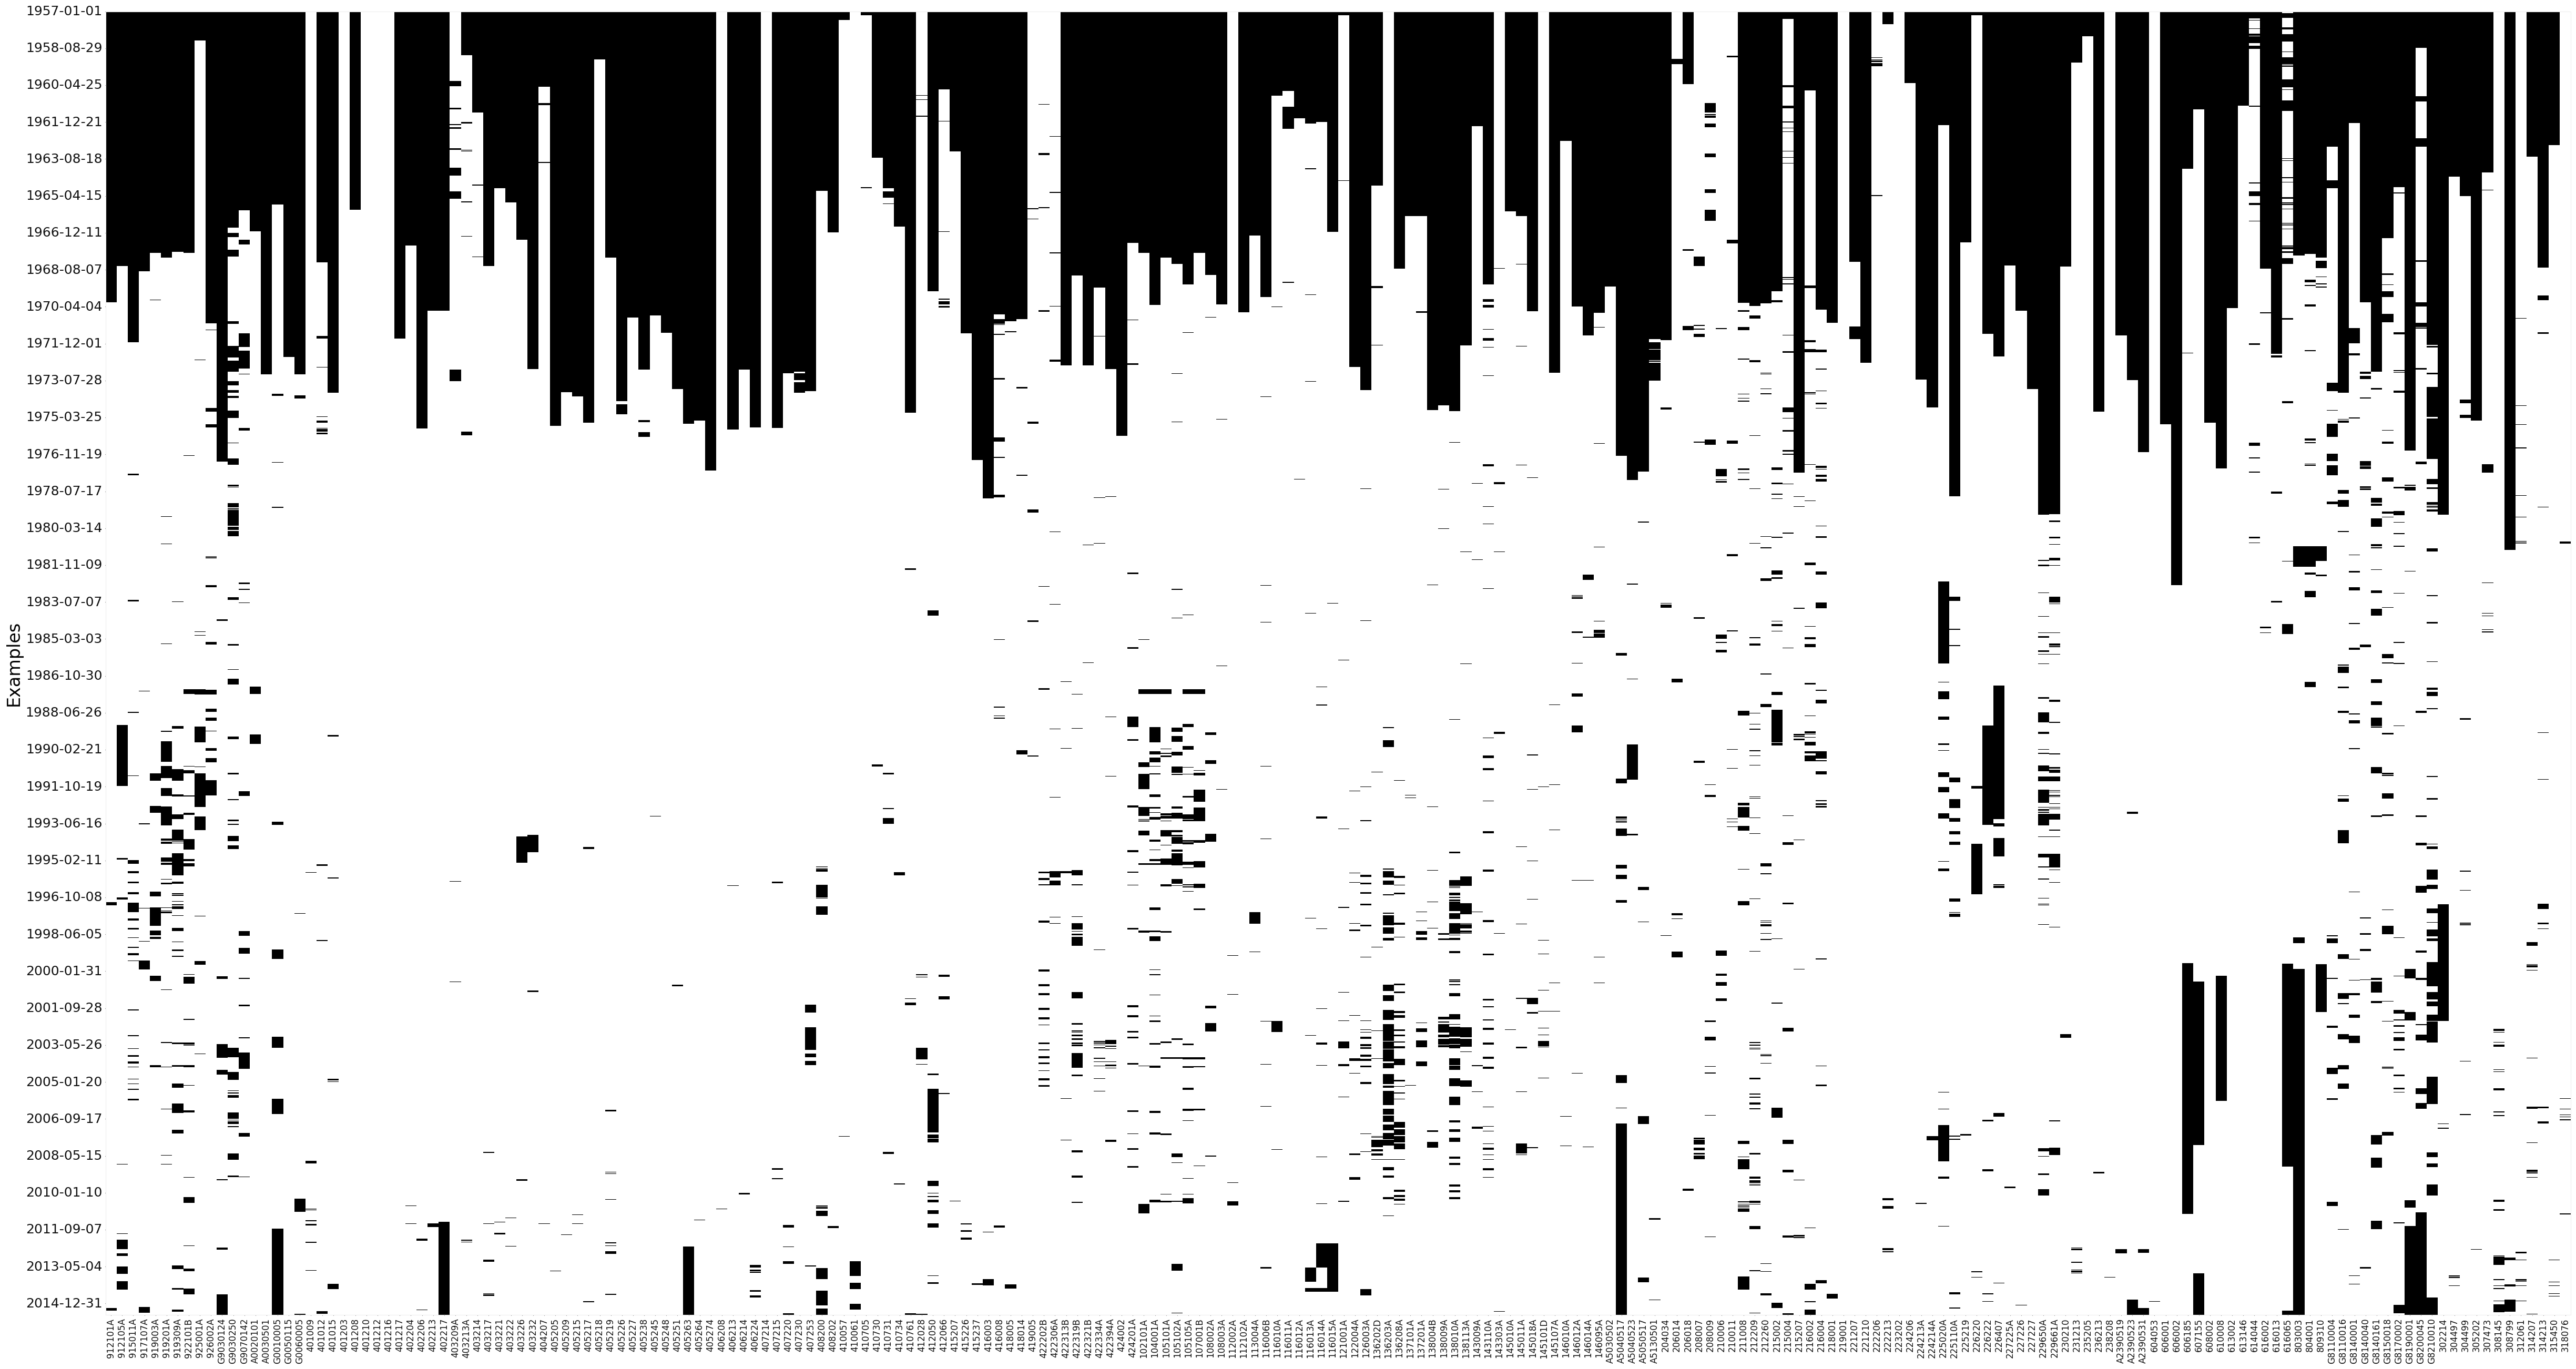
EDA(data=static, save=False).heatmap()
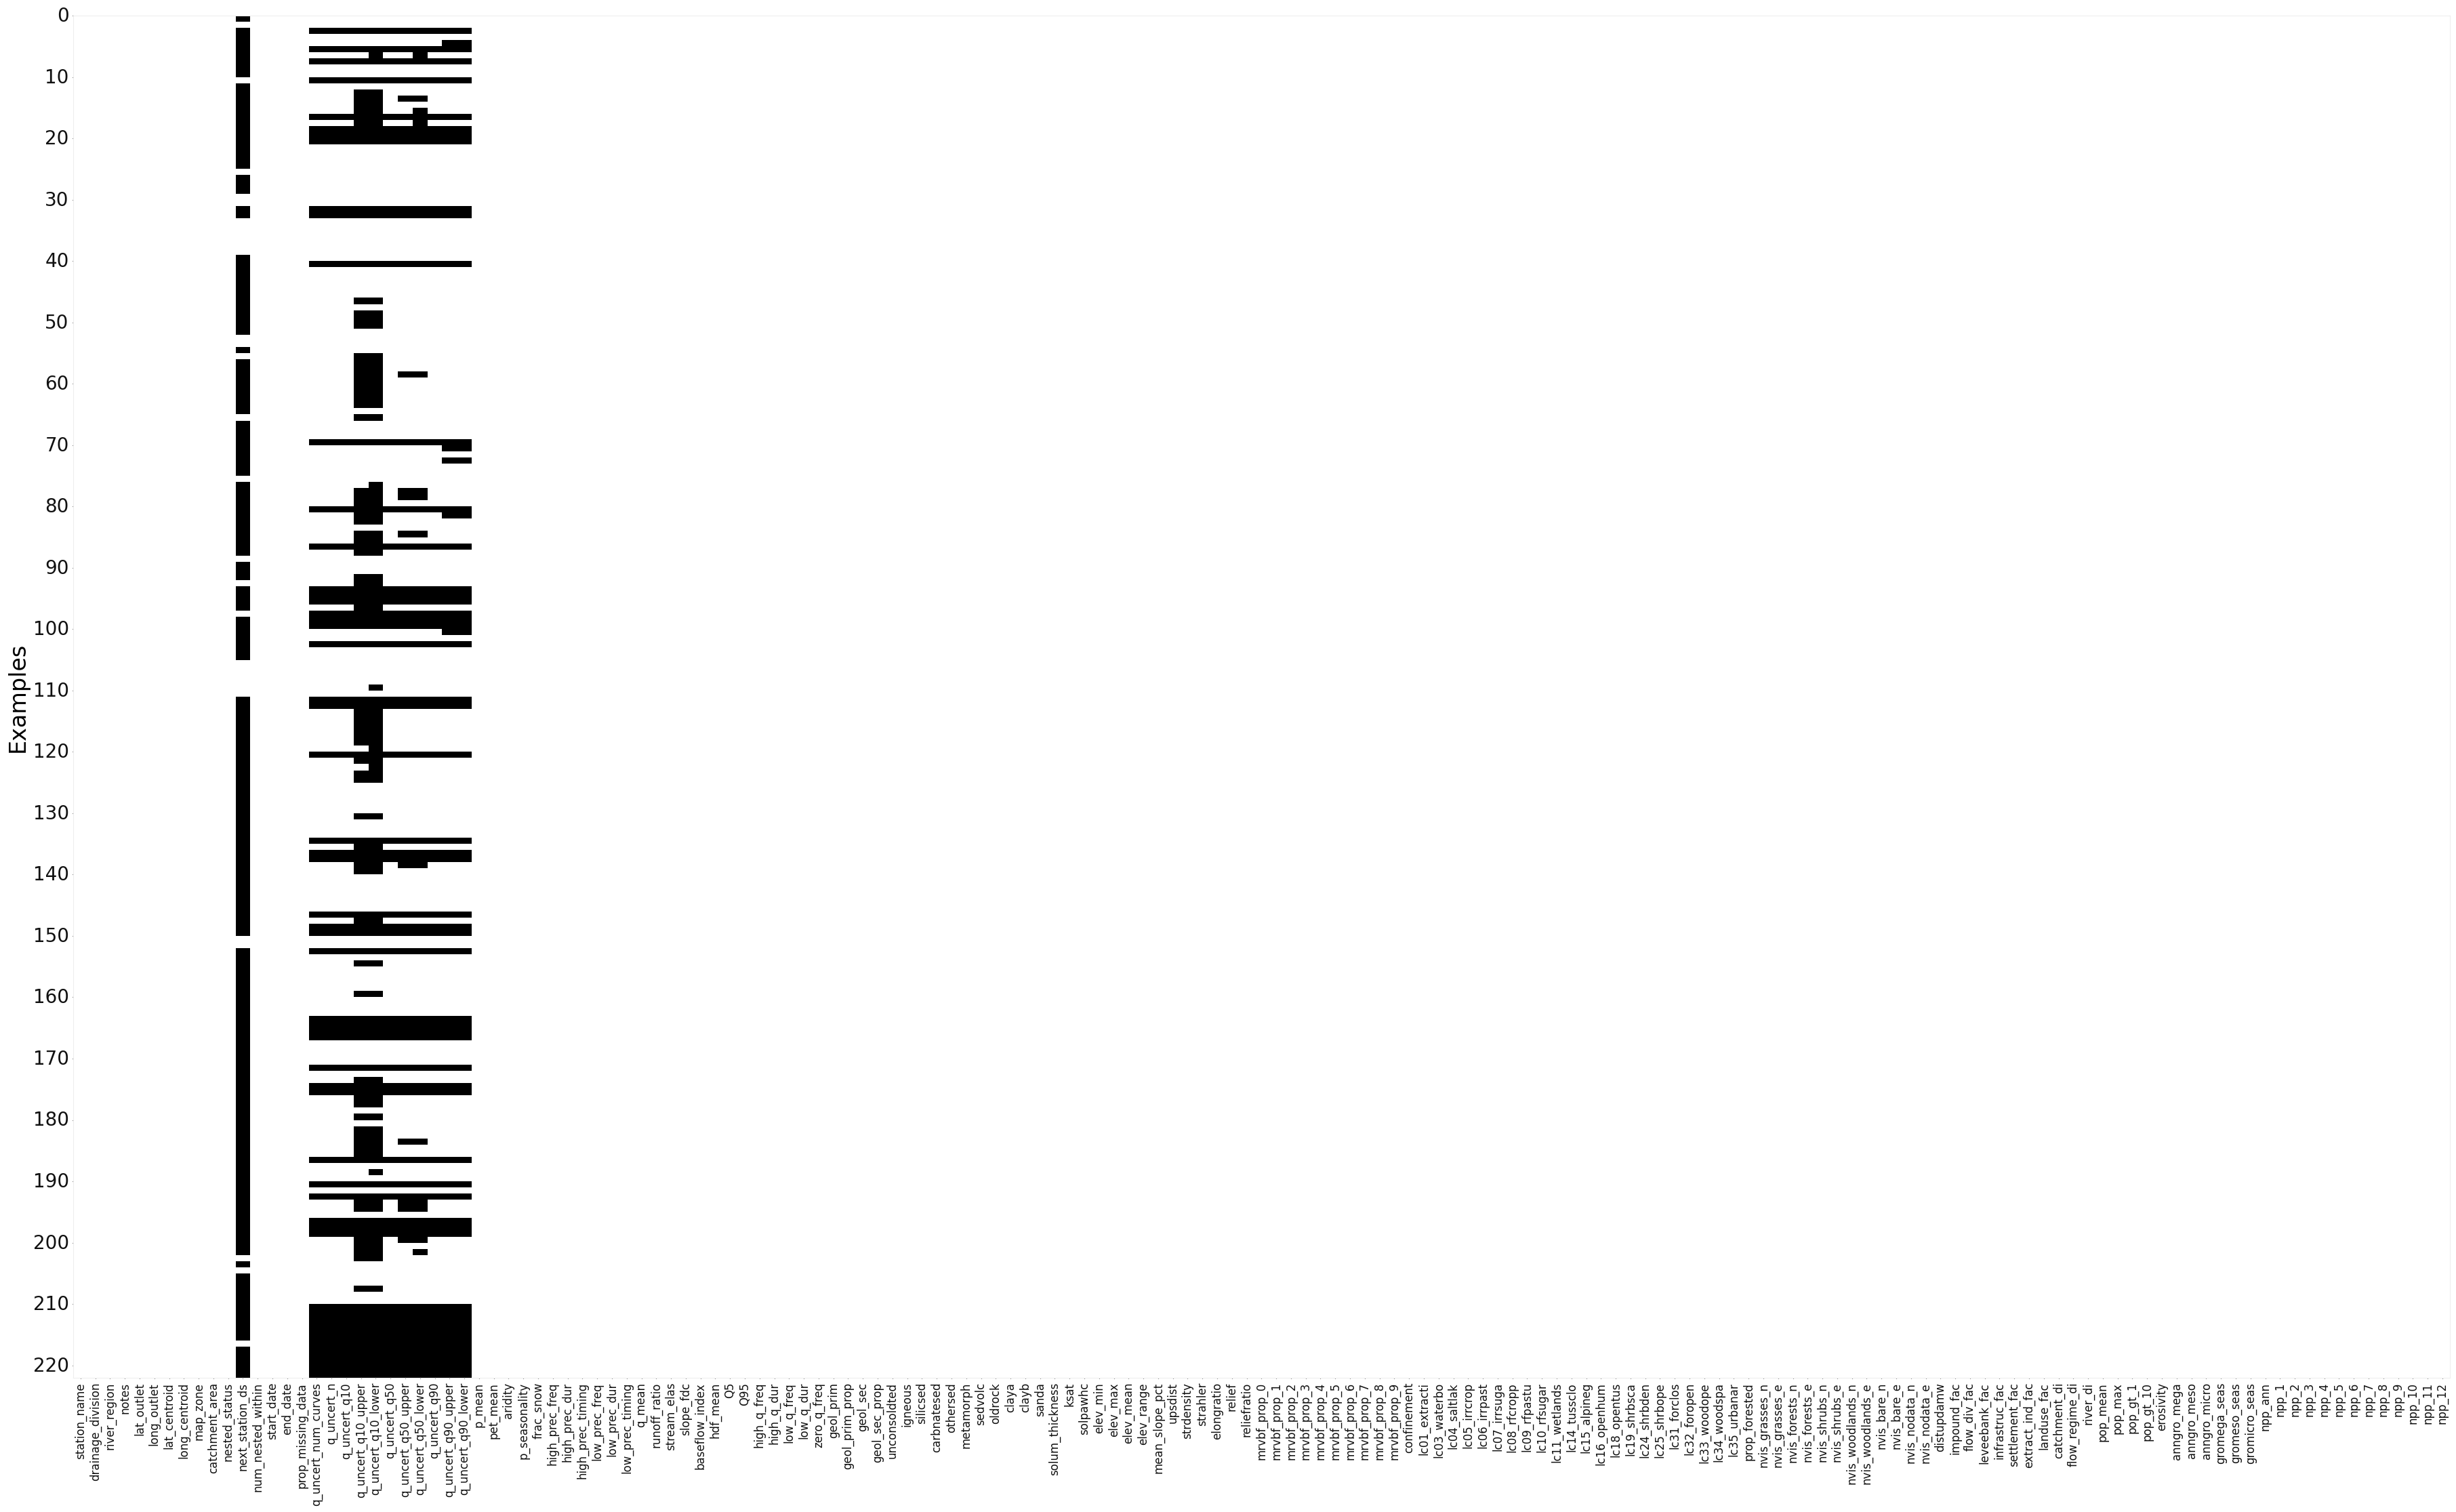
[11]:
<AxesSubplot: ylabel='Examples'>
[12]:
physical_features = []
soil_features = []
geological_features = []
flow_characteristics = []
[13]:
static = static.dropna(axis=1)
static.shape
[13]:
(222, 149)
[14]:
coords = dataset.stn_coords()
coords
[14]:
| lat | long | |
|---|---|---|
| station_id | ||
| 912101A | -18.643611 | 139.253056 |
| 912105A | -18.970833 | 138.803333 |
| 915011A | -20.177500 | 144.524444 |
| 917107A | -18.133611 | 144.306667 |
| 919003A | -16.471389 | 144.290556 |
| ... | ... | ... |
| 312061 | -41.419444 | 145.670556 |
| 314207 | -41.250833 | 146.090000 |
| 314213 | -40.872222 | 145.297778 |
| 315450 | -41.611667 | 146.130556 |
| 318076 | -41.494444 | 147.384167 |
222 rows × 2 columns
[15]:
dataset.plot_stations()
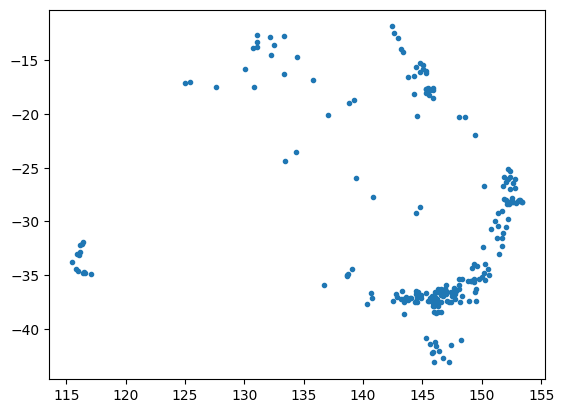
[15]:
<AxesSubplot: >
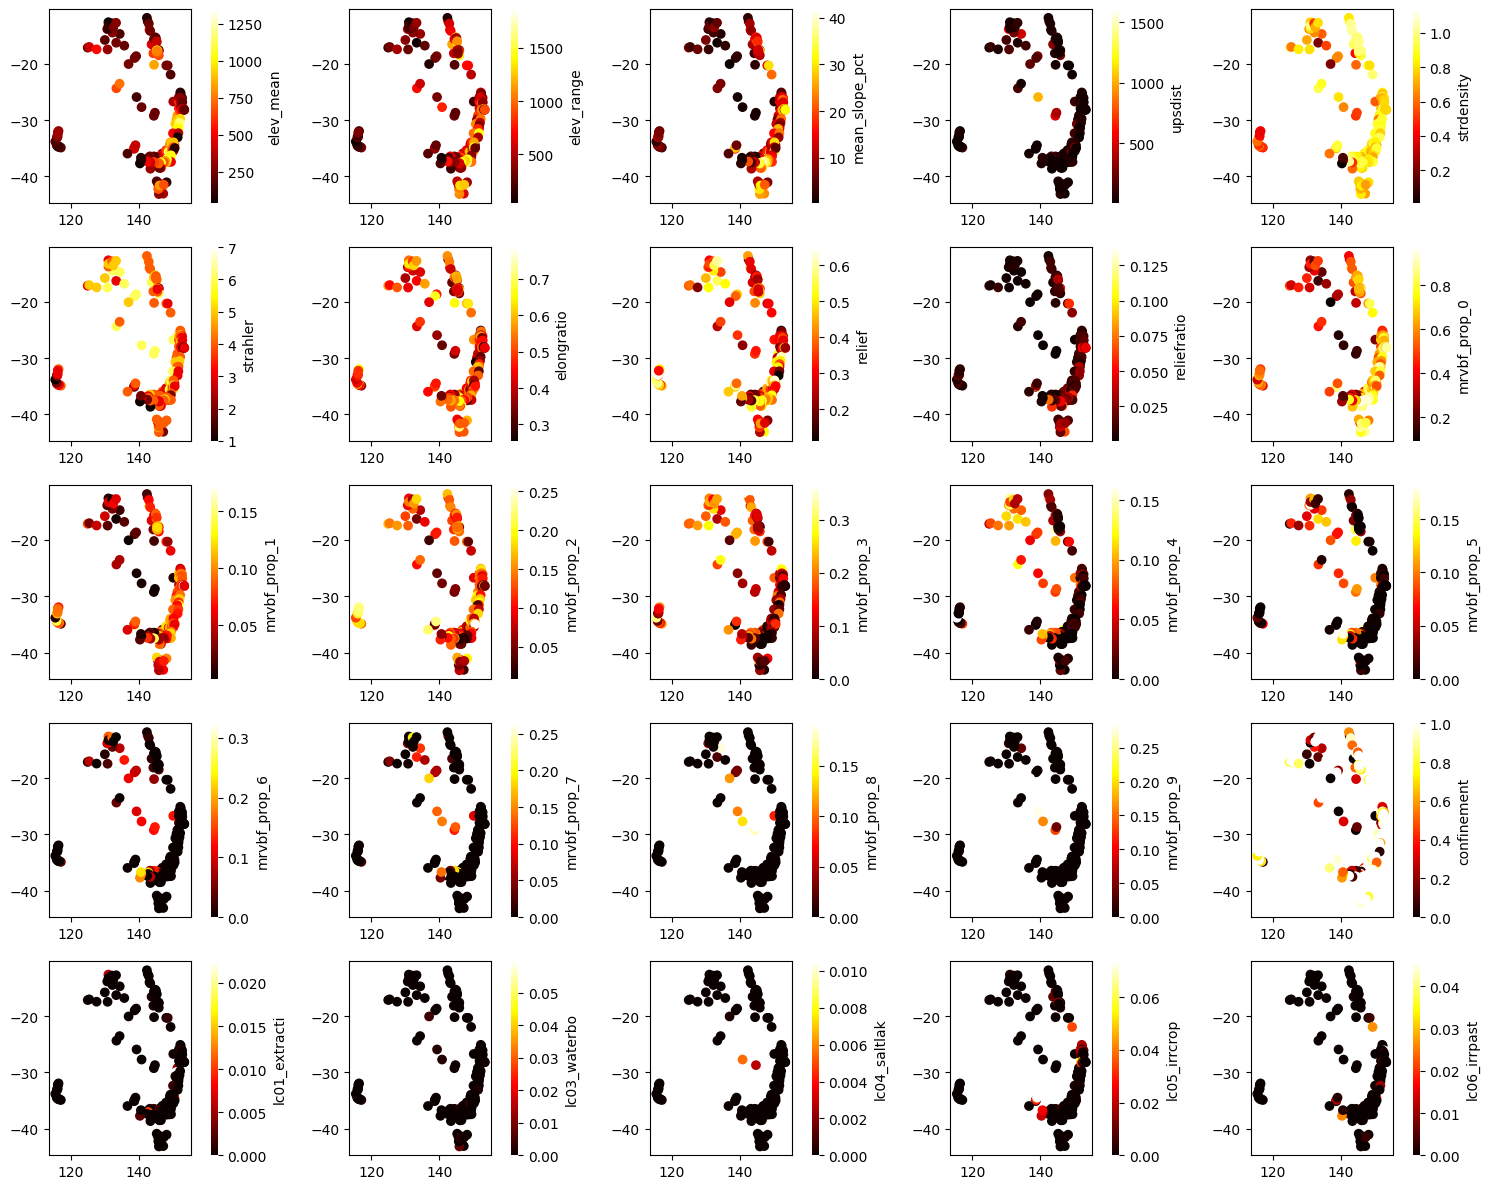
[16]:
[17]:
idx = 0
ax_num = 0

fig, axes = plt.subplots(5, 5, figsize=(15, 12))
axes = axes.flatten()

while ax_num < 25:

    val = static.iloc[:, idx]
    idx += 1

    try:
        c = val.astype(float).values.reshape(-1,)

        en = 222
        ax = axes[ax_num]
        ax, sc = scatter(long[0:en], lat[0:en], c=c[0:en], cmap="hot", show=False, ax=ax)

        process_cbar(ax, sc, border=False, title=val.name, #title_kws ={"fontsize": 14}
                    )
        ax_num += 1
    except ValueError:
        continue


plt.tight_layout()
plt.show()
print(idx)
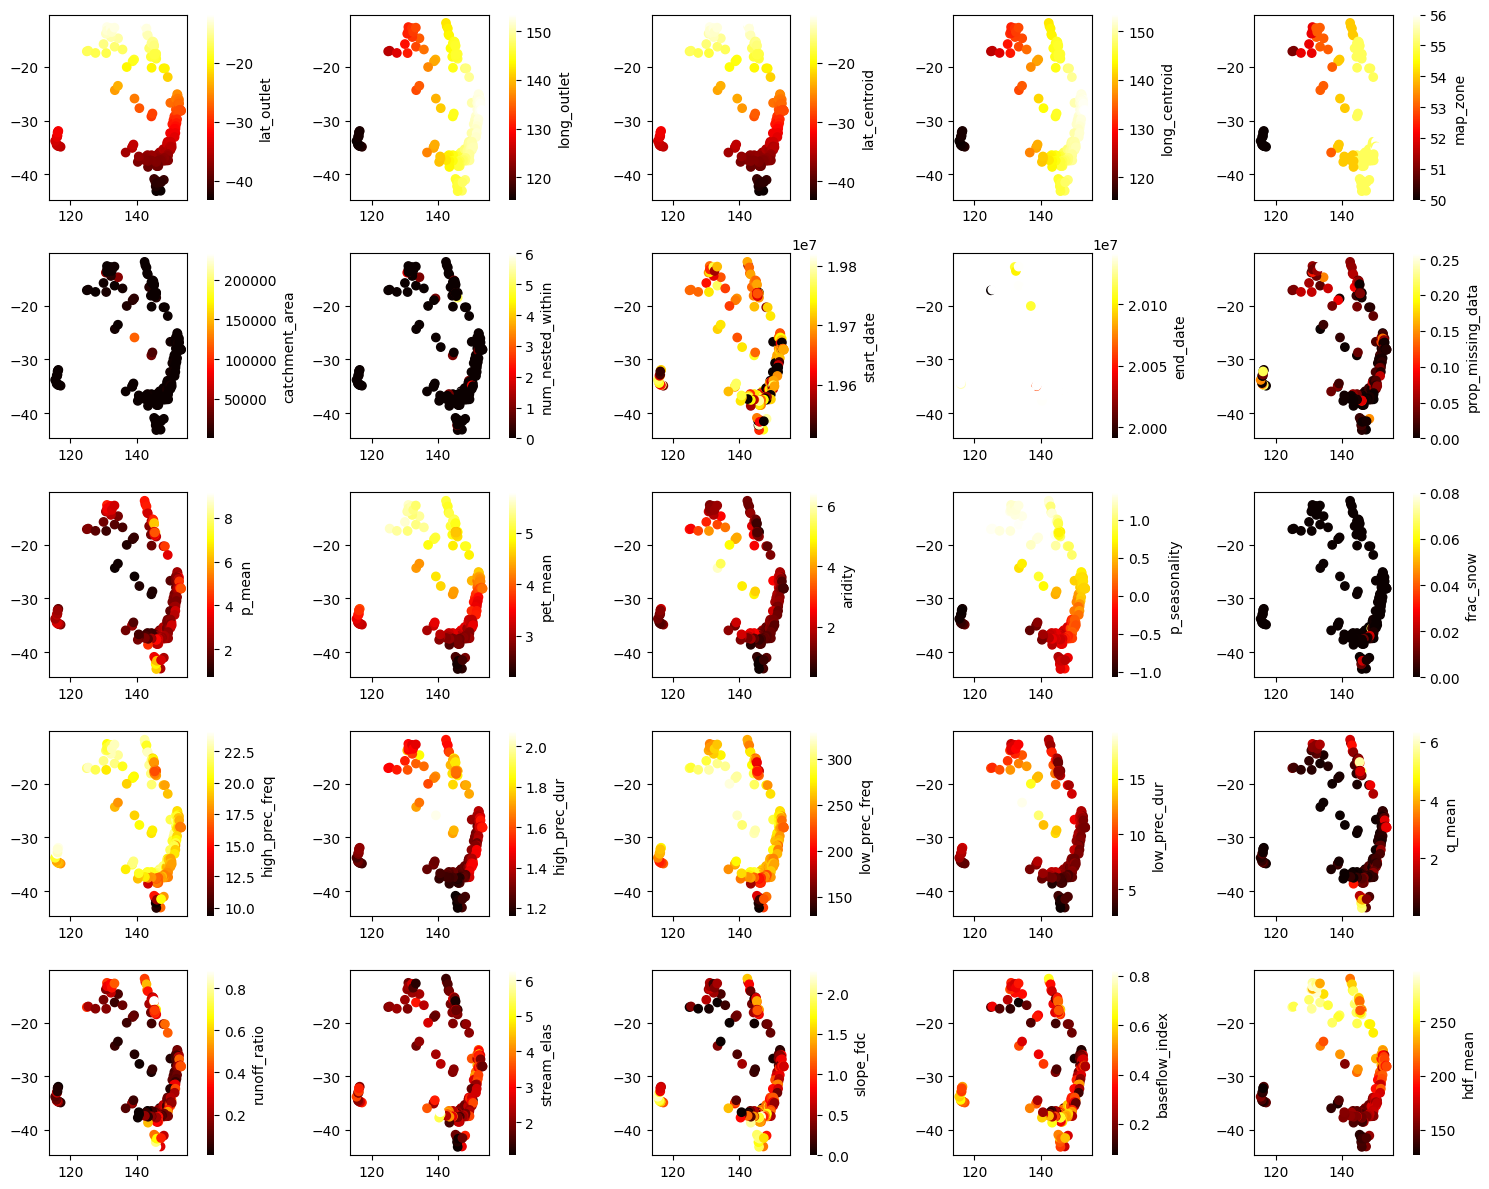
32
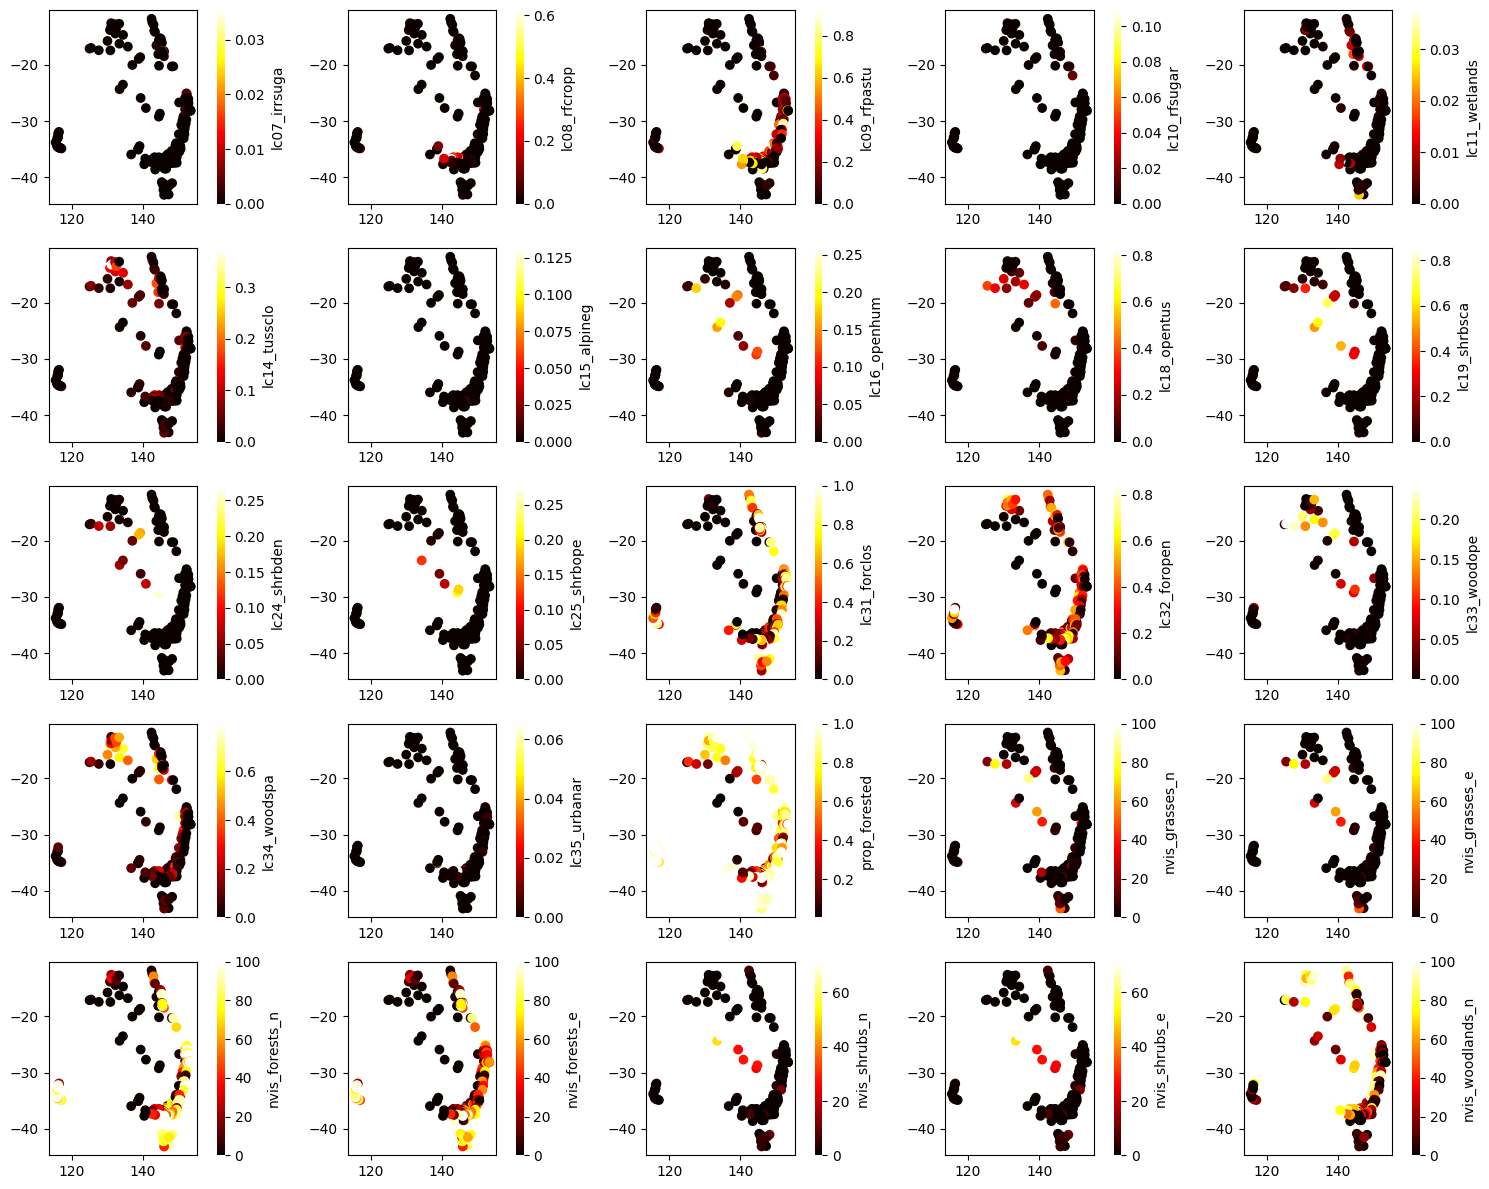
[18]:
idx = 32
ax_num = 0

fig, axes = plt.subplots(5, 5, figsize=(15, 12))
axes = axes.flatten()

while ax_num < 25:

    val = static.iloc[:, idx]
    idx += 1

    try:
        c = val.astype(float).values.reshape(-1,)

        en = 222
        ax = axes[ax_num]
        ax, sc = scatter(long[0:en], lat[0:en], c=c[0:en], cmap="hot", show=False, ax=ax)

        process_cbar(ax, sc, border=False, title=val.name, #title_kws ={"fontsize": 14}
                    )
        ax_num += 1
    except ValueError:
        continue


plt.tight_layout()
plt.show()
print(idx)
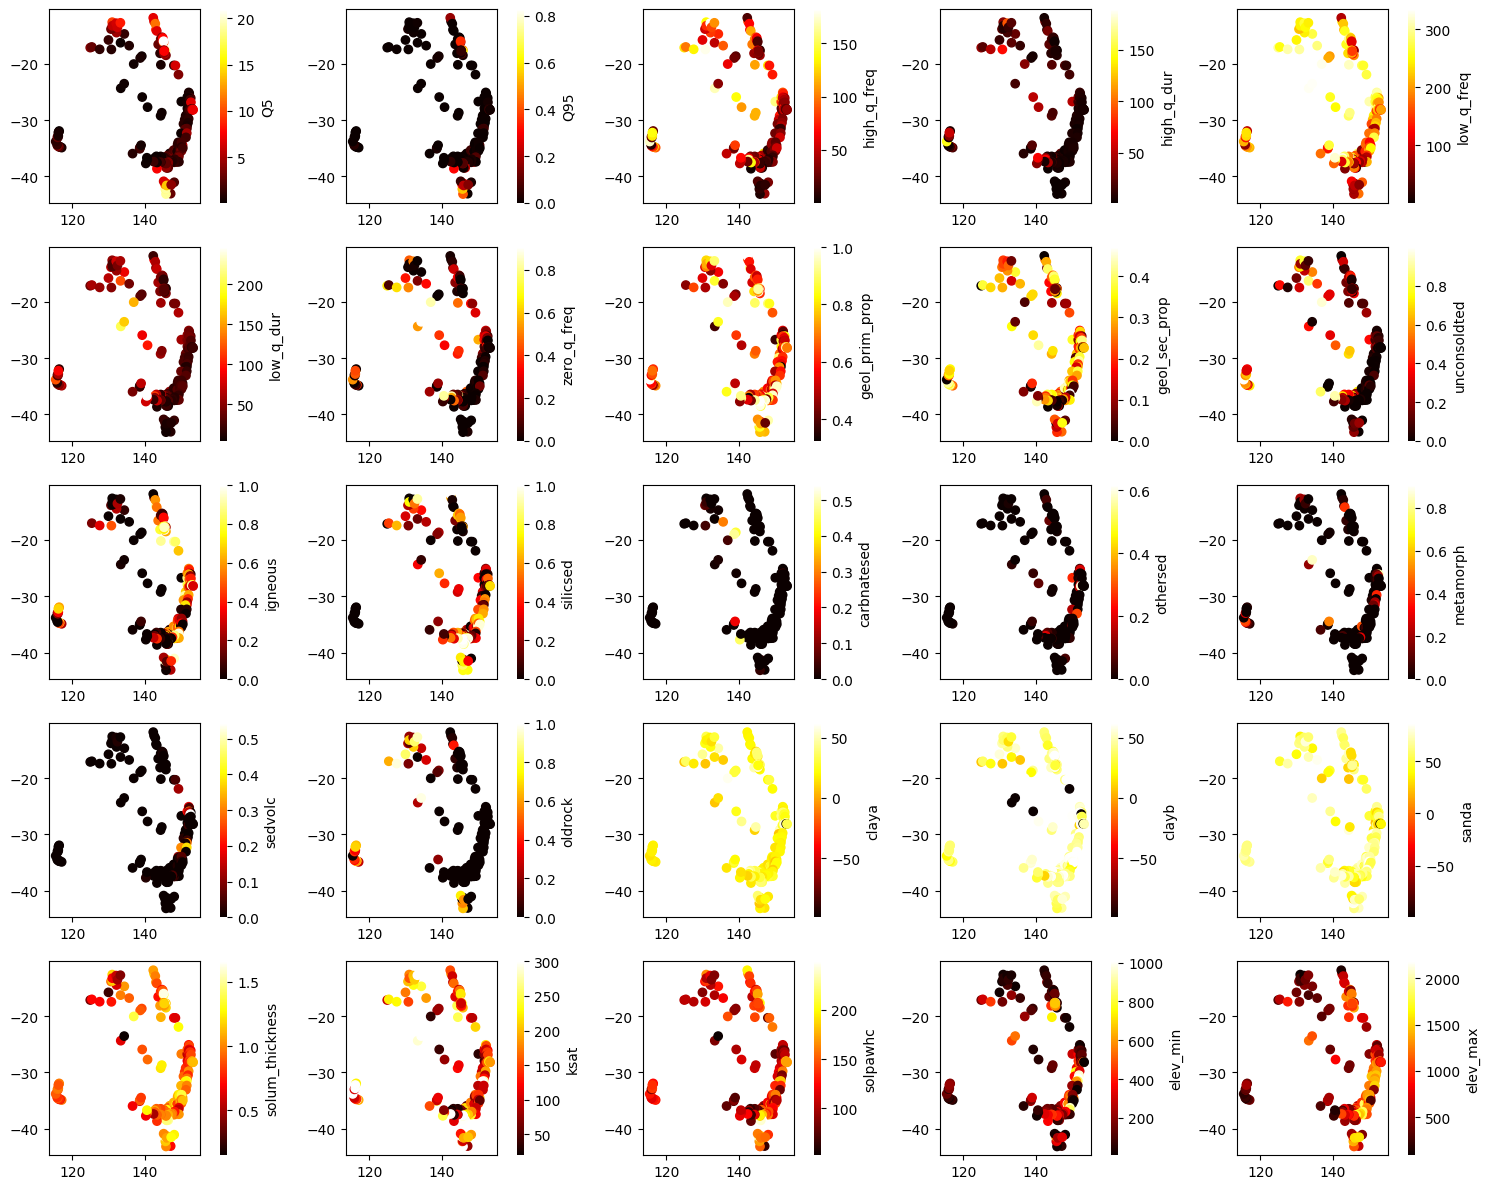
59
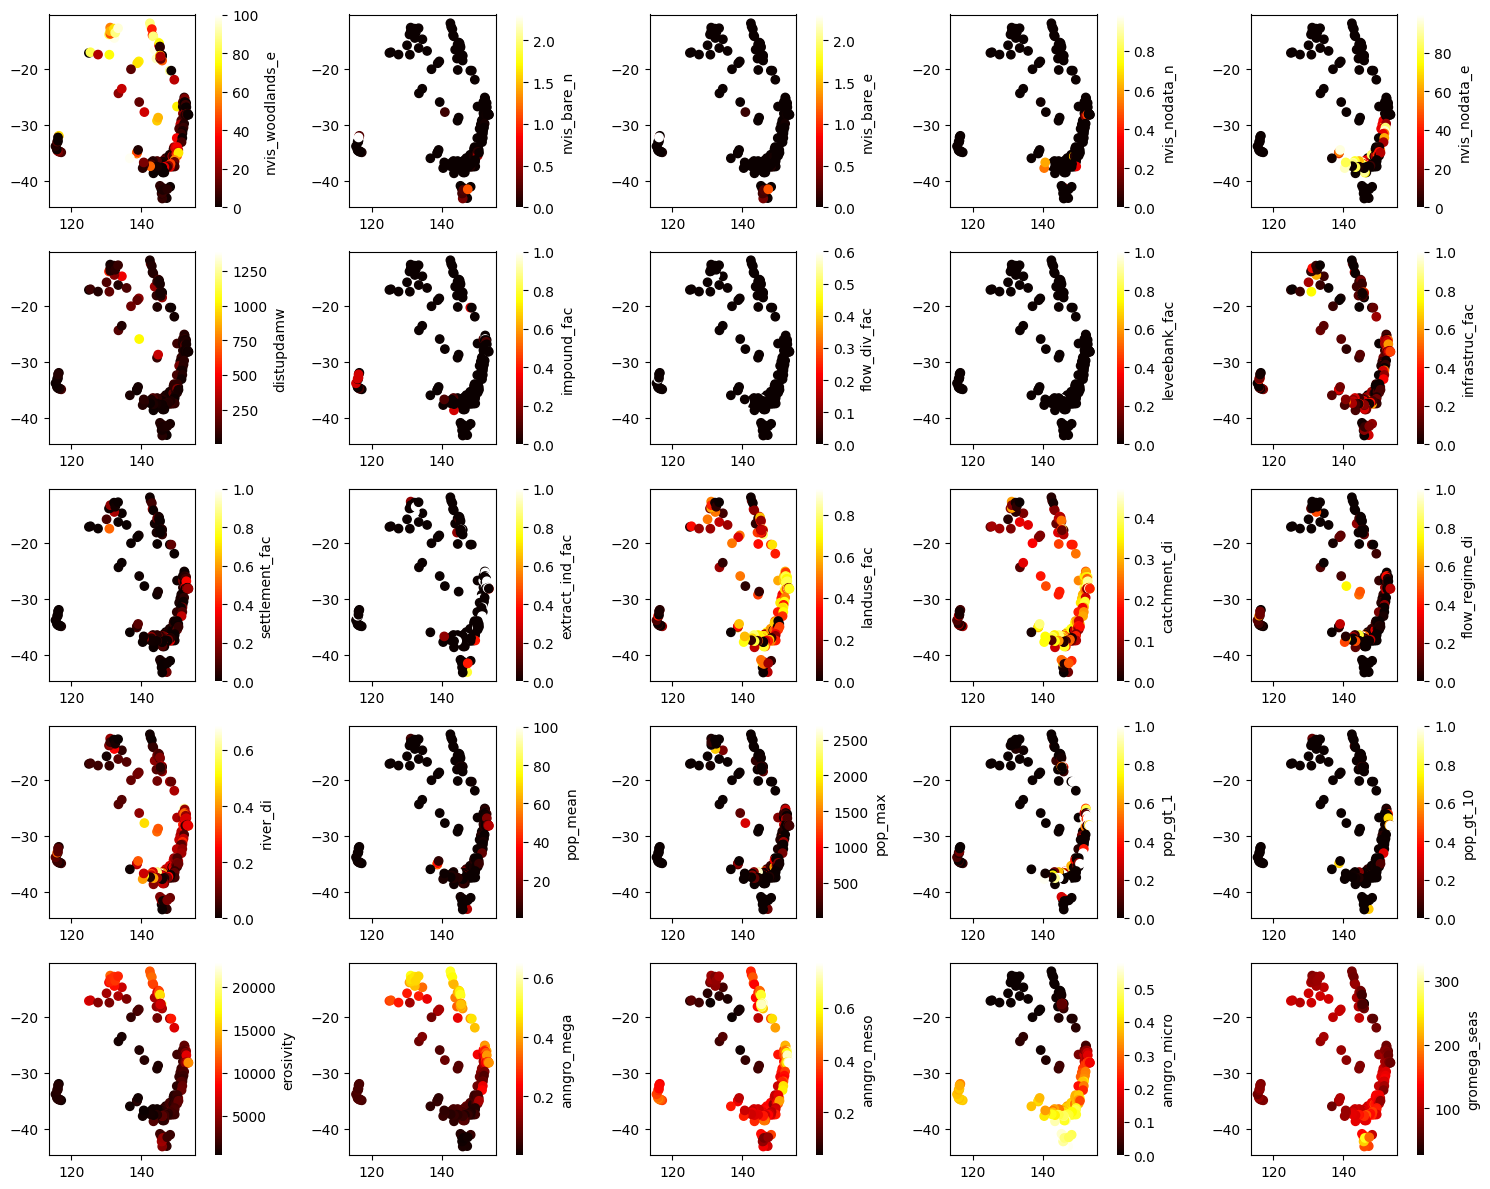
[19]:
idx = 59
ax_num = 0

fig, axes = plt.subplots(5, 5, figsize=(15, 12))
axes = axes.flatten()

while ax_num < 25:

    val = static.iloc[:, idx]
    idx += 1

    try:
        c = val.astype(float).values.reshape(-1,)

        en = 222
        ax = axes[ax_num]
        ax, sc = scatter(long[0:en], lat[0:en], c=c[0:en], cmap="hot", show=False, ax=ax)

        process_cbar(ax, sc, border=False, title=val.name, #title_kws ={"fontsize": 14}
                    )
        ax_num += 1
    except ValueError:
        continue


plt.tight_layout()
plt.show()
print(idx)
84
[20]:
idx = 84
ax_num = 0

fig, axes = plt.subplots(5, 5, figsize=(15, 12))
axes = axes.flatten()

while ax_num < 25:

    val = static.iloc[:, idx]
    idx += 1

    try:
        c = val.astype(float).values.reshape(-1,)

        en = 222
        ax = axes[ax_num]
        ax, sc = scatter(long[0:en], lat[0:en], c=c[0:en], cmap="hot", show=False, ax=ax)

        process_cbar(ax, sc, border=False, title=val.name, #title_kws ={"fontsize": 14}
                    )
        ax_num += 1
    except ValueError:
        continue


plt.tight_layout()
plt.show()
print(idx)
109
[21]:
idx = 109
ax_num = 0

fig, axes = plt.subplots(5, 5, figsize=(15, 12))
axes = axes.flatten()

while ax_num < 25:

    val = static.iloc[:, idx]
    idx += 1

    try:
        c = val.astype(float).values.reshape(-1,)

        en = 222
        ax = axes[ax_num]
        ax, sc = scatter(long[0:en], lat[0:en], c=c[0:en], cmap="hot", show=False, ax=ax)

        process_cbar(ax, sc, border=False, title=val.name, #title_kws ={"fontsize": 14}
                    )
        ax_num += 1
    except ValueError:
        continue

plt.tight_layout()
plt.show()
print(idx)
134
[22]:
idx = 134
ax_num = 0

fig, axes = plt.subplots(5, 5, figsize=(15, 12))
axes = axes.flatten()

while ax_num < 25 and idx<static.shape[1]:

    val = static.iloc[:, idx]
    idx += 1

    try:
        c = val.astype(float).values.reshape(-1,)

        en = 222
        ax = axes[ax_num]
        ax, sc = scatter(long[0:en], lat[0:en], c=c[0:en], cmap="hot", show=False, ax=ax)

        process_cbar(ax, sc, border=False, title=val.name, #title_kws ={"fontsize": 14}
                    )
        ax_num += 1
    except ValueError:
        continue

plt.tight_layout()
plt.show()
print(idx)
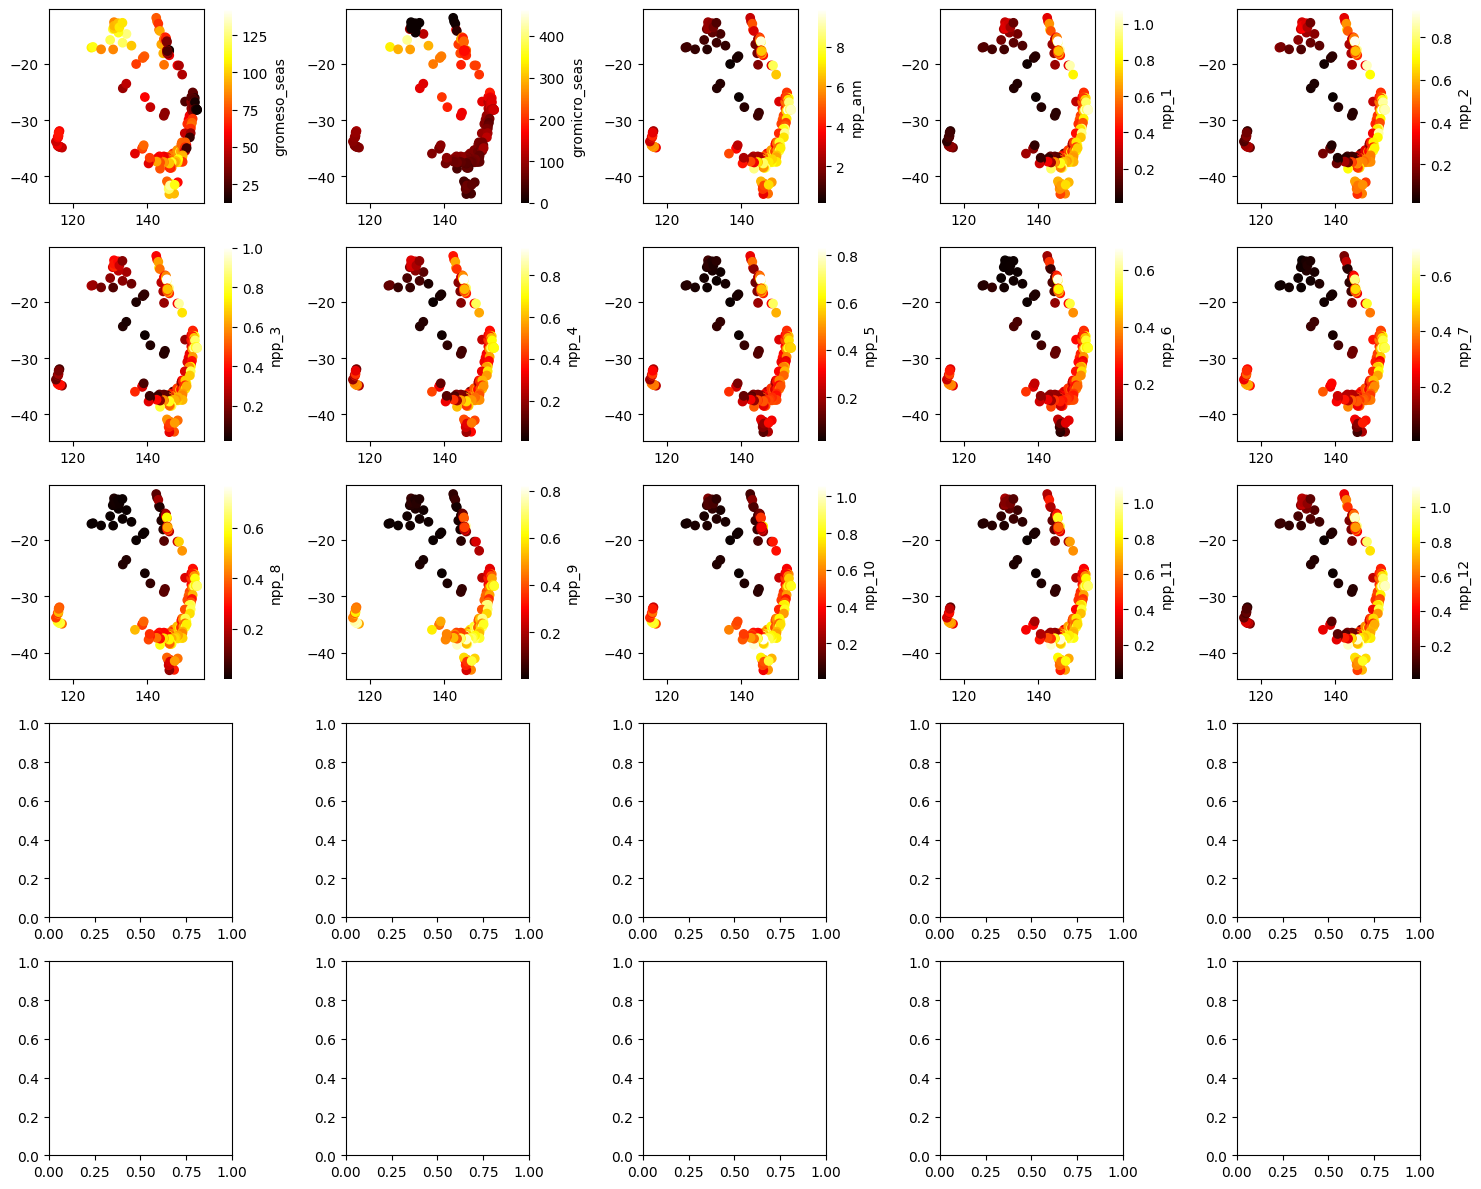
149
Dyanmic Features
[23]:
dataset.dynamic_features
[23]:
['streamflow_MLd',
 'streamflow_MLd_inclInfilled',
 'streamflow_mmd',
 'et_morton_actual_SILO',
 'et_morton_point_SILO',
 'et_morton_wet_SILO',
 'et_short_crop_SILO',
 'et_tall_crop_SILO',
 'evap_morton_lake_SILO',
 'evap_pan_SILO',
 'evap_syn_SILO',
 'precipitation_AWAP',
 'precipitation_SILO',
 'precipitation_var_SWAP',
 'solarrad_AWAP',
 'tmax_AWAP',
 'tmin_AWAP',
 'vprp_AWAP',
 'mslp_SILO',
 'radiation_SILO',
 'rh_tmax_SILO',
 'rh_tmin_SILO',
 'tmax_SILO',
 'tmin_SILO',
 'vp_deficit_SILO',
 'vp_SILO']
Streamflow
streamflow normalized by area
[24]:
streamflow = dataset.q_mmd()

streamflow.shape
[24]:
(21184, 222)
[25]:
streamflow
[25]:
| 912101A | 912105A | 915011A | 917107A | 919003A | 919201A | 919309A | 922101B | 925001A | 926002A | ... | 304499 | 305202 | 307473 | 308145 | 308799 | 312061 | 314207 | 314213 | 315450 | 318076 | |
|---|---|---|---|---|---|---|---|---|---|---|---|---|---|---|---|---|---|---|---|---|---|
| time | |||||||||||||||||||||
| 1957-01-01 | NaN | NaN | NaN | NaN | NaN | NaN | NaN | NaN | NaN | NaN | ... | NaN | NaN | NaN | 24.086996 | NaN | 4.093378 | NaN | NaN | NaN | 0.614182 |
| 1957-01-02 | NaN | NaN | NaN | NaN | NaN | NaN | NaN | NaN | NaN | NaN | ... | NaN | NaN | NaN | 8.254936 | NaN | 4.266787 | NaN | NaN | NaN | 0.691010 |
| 1957-01-03 | NaN | NaN | NaN | NaN | NaN | NaN | NaN | NaN | NaN | NaN | ... | NaN | NaN | NaN | 4.943169 | NaN | 4.095510 | NaN | NaN | NaN | 0.559474 |
| 1957-01-04 | NaN | NaN | NaN | NaN | NaN | NaN | NaN | NaN | NaN | NaN | ... | NaN | NaN | NaN | 3.404512 | NaN | 4.297611 | NaN | NaN | NaN | 0.508319 |
| 1957-01-05 | NaN | NaN | NaN | NaN | NaN | NaN | NaN | NaN | NaN | NaN | ... | NaN | NaN | NaN | 3.317023 | NaN | 4.293357 | NaN | NaN | NaN | 0.478276 |
| ... | ... | ... | ... | ... | ... | ... | ... | ... | ... | ... | ... | ... | ... | ... | ... | ... | ... | ... | ... | ... | ... |
| 2014-12-27 | 0.033409 | 0.032417 | 0.000000 | 0.010655 | 0.003816 | 0.0 | 0.0 | 0.0 | 0.036582 | 0.300530 | ... | 0.505348 | 0.447075 | 2.489122 | 1.391061 | 1.407268 | 0.547383 | 0.415754 | 0.093841 | 0.944416 | 0.243313 |
| 2014-12-28 | 0.037260 | 0.028840 | 0.000000 | 0.010369 | 0.002212 | 0.0 | 0.0 | 0.0 | 0.036308 | 0.293852 | ... | 0.506314 | 0.126054 | 2.198925 | 1.255558 | 1.330847 | 0.524695 | 0.386941 | 0.084121 | 0.881395 | 0.219409 |
| 2014-12-29 | 0.037653 | 0.027334 | 0.000000 | 0.010321 | 0.001903 | 0.0 | 0.0 | 0.0 | 0.036154 | 0.292314 | ... | 0.482631 | 0.057792 | 1.557511 | 1.061568 | 1.150340 | 0.501252 | 0.378870 | 0.075581 | 0.802402 | 0.207761 |
| 2014-12-30 | 0.032432 | 0.027785 | 0.000000 | 0.028903 | 0.001662 | 0.0 | 0.0 | 0.0 | 0.034776 | 0.293543 | ... | 0.548162 | 0.041354 | 1.354081 | 12.621202 | 17.800031 | 0.731634 | 0.387640 | 0.078101 | 7.128175 | 0.205275 |
| 2014-12-31 | 0.032191 | 0.169300 | 0.003321 | 0.042891 | 0.002262 | 0.0 | 0.0 | 0.0 | 0.034613 | 0.291518 | ... | 2.707964 | 0.135351 | 11.706610 | 10.158581 | 9.200823 | 1.745331 | 1.042905 | 0.134921 | 6.993984 | 0.223863 |
21184 rows × 222 columns
[26]:
EDA(data=streamflow, save=False).heatmap()
[26]:
<AxesSubplot: ylabel='Examples'>
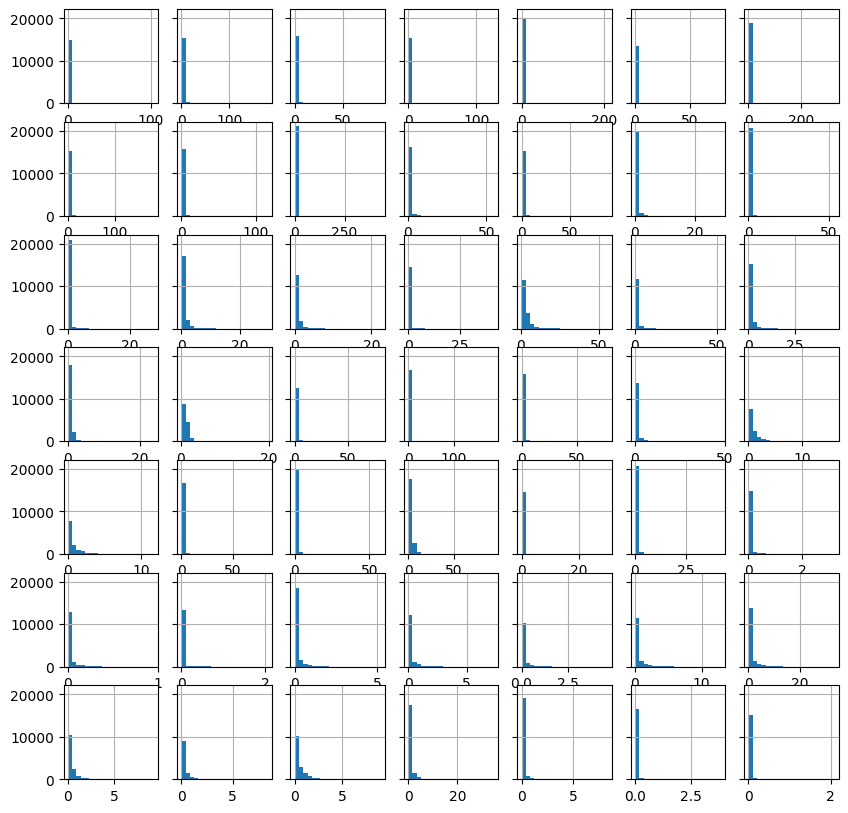
[27]:
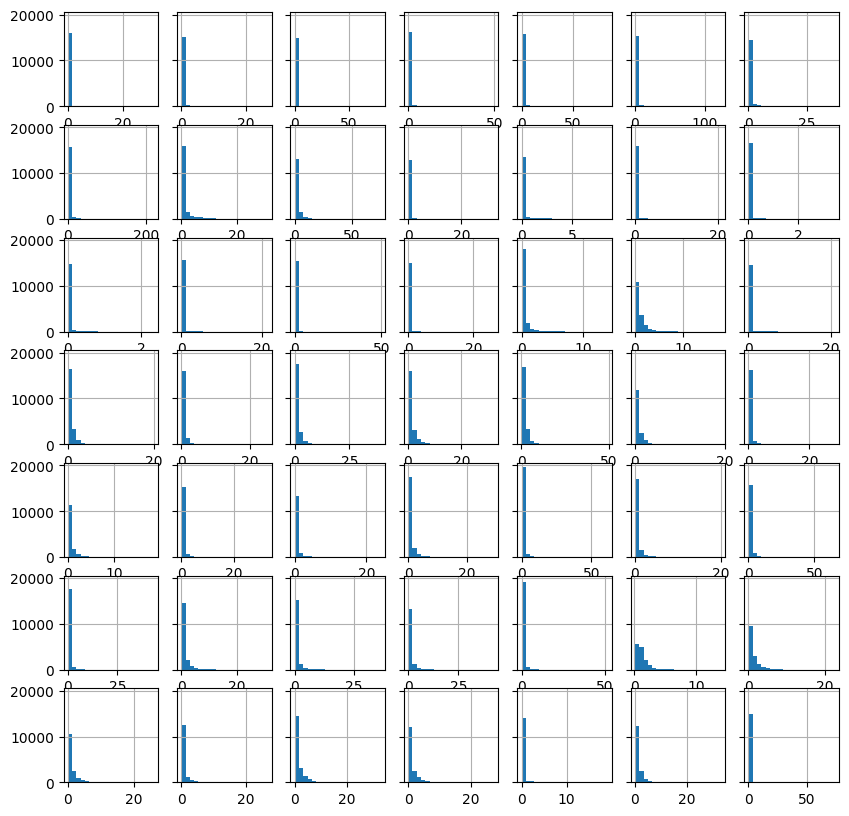
fig, axes = plt.subplots(7, 7, figsize=(10, 10), sharey="all")

for idx, ax in enumerate(axes.flat):

    hist(streamflow.iloc[:, idx].values.reshape(-1,),
         bins=20,
         ax=ax,
         show=False
        )

plt.show()
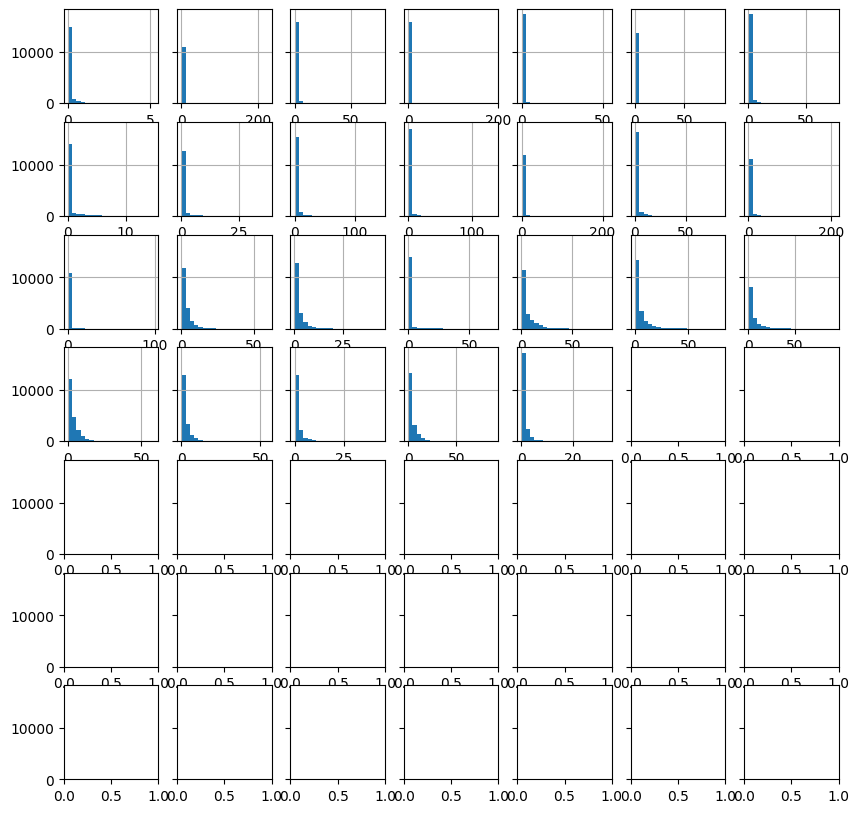
[28]:
st = 49

fig, axes = plt.subplots(7, 7, figsize=(10, 10), sharey="all")

idx = st
for _, ax in enumerate(axes.flat):

    hist(streamflow.iloc[:, idx].values.reshape(-1,),
         bins=20,
         ax=ax,
         show=False
        )

    idx += 1

plt.show()
print(idx)
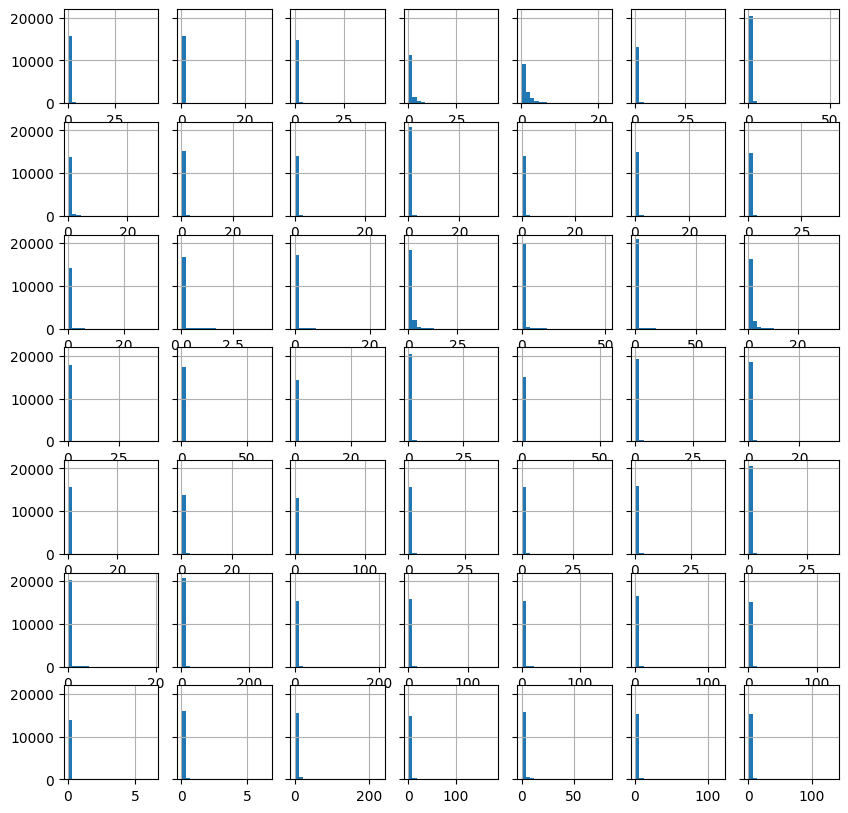
98
[29]:
st = 98

fig, axes = plt.subplots(7, 7, figsize=(10, 10), sharey="all")

idx = st
for _, ax in enumerate(axes.flat):

    hist(streamflow.iloc[:, idx].values.reshape(-1,),
         bins=20,
         ax=ax,
         show=False
        )

    idx += 1

plt.show()
print(idx)
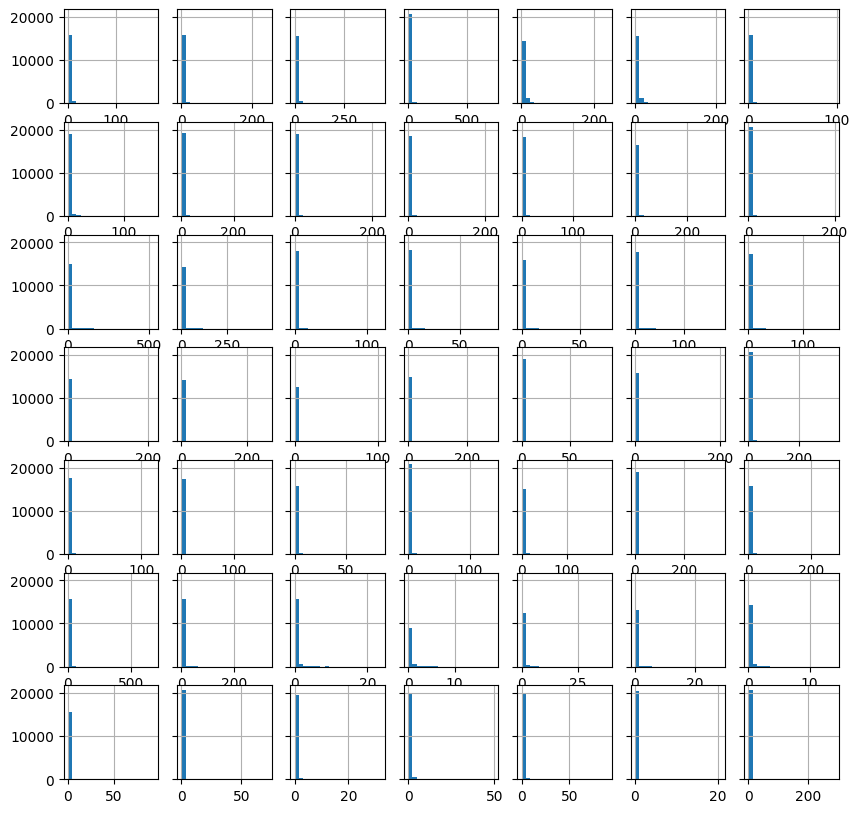
147
[30]:
st = 147

fig, axes = plt.subplots(7, 7, figsize=(10, 10), sharey="all")

idx = st
for _, ax in enumerate(axes.flat):

    hist(streamflow.iloc[:, idx].values.reshape(-1,),
         bins=20,
         ax=ax,
         show=False
        )

    idx += 1

plt.show()
print(idx)
196
[31]:
st = 196

fig, axes = plt.subplots(7, 7, figsize=(10, 10), sharey="all")

idx = st
for _, ax in enumerate(axes.flat):

    if idx > 221:
        pass
    else:
        hist(streamflow.iloc[:, idx].values.reshape(-1,),
         bins=20,
         ax=ax,
         show=False
        )

    idx += 1

plt.show()
print(idx)
245
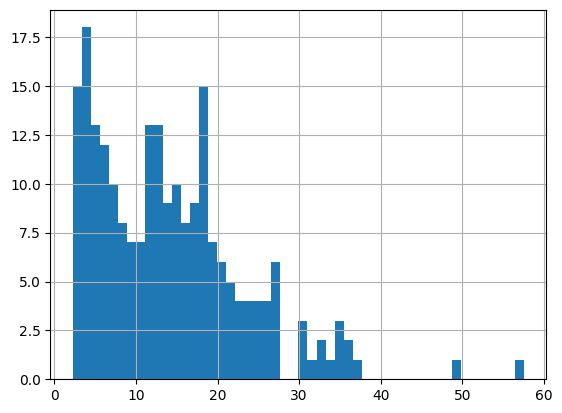
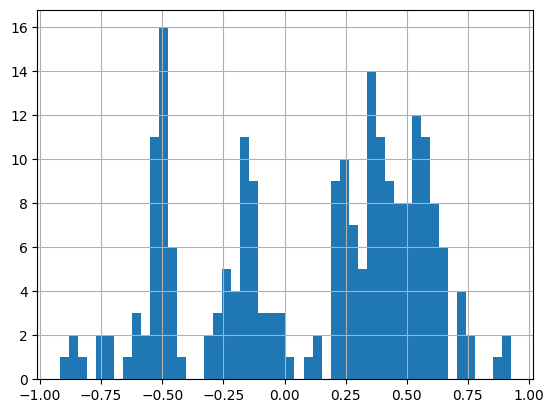
[32]:
_ = hist(streamflow.skew().values.reshape(-1,), bins=50)
Evapotranspiration
[60]:
et_morton_actual_SILO = dataset.fetch(dynamic_features = 'et_morton_actual_SILO', as_dataframe=True)
et_morton_actual_SILO = et_morton_actual_SILO.reset_index()
et_morton_actual_SILO.index = pd.to_datetime(et_morton_actual_SILO.pop('time'))
et_morton_actual_SILO.pop('dynamic_features')
print(et_morton_actual_SILO.shape)
print(et_morton_actual_SILO.isna().sum())
EDA(data=et_morton_actual_SILO, save=False).heatmap()
(21184, 222)
912101A    0
912105A    0
915011A    0
917107A    0
919003A    0
          ..
312061     0
314207     0
314213     0
315450     0
318076     0
Length: 222, dtype: int64

[60]:
<AxesSubplot: ylabel='Examples'>
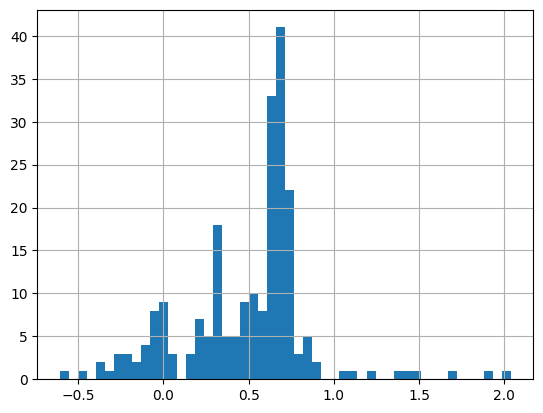
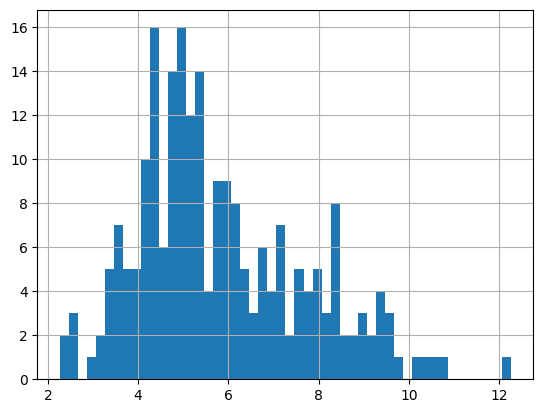
[61]:
_ = hist(et_morton_actual_SILO.skew().values.reshape(-1,), bins=50)
Air Temperature
[ ]:
tmax_SILO = dataset.fetch(dynamic_features = 'tmax_SILO', as_dataframe=True)
tmax_SILO = tmax_SILO.reset_index()
tmax_SILO.index = pd.to_datetime(tmax_SILO.pop('time'))
tmax_SILO.pop('dynamic_features')
print(tmax_SILO.shape)

tmin_SILO = dataset.fetch(dynamic_features = 'tmin_SILO', as_dataframe=True)
tmin_SILO = tmin_SILO.reset_index()
tmin_SILO.index = pd.to_datetime(tmin_SILO.pop('time'))
tmin_SILO.pop('dynamic_features')
print(tmin_SILO.shape)

tavg = np.mean([tmax_SILO.values, tmin_SILO.values], axis=0)
print(tavg.shape)

tavg = pd.DataFrame(tavg, index = tmin_SILO.index, columns=tmin_SILO.columns.tolist())
print(tavg.shape)

EDA(data=tavg, save=False).heatmap()
[66]:
_ = hist(tavg.skew().values.reshape(-1,), bins=50)
Precipitation
[64]:
pcp = dataset.fetch(dynamic_features = 'precipitation_SILO', as_dataframe=True)
pcp = pcp.reset_index()
pcp.index = pd.to_datetime(pcp.pop('time'))
pcp.pop('dynamic_features')
print(pcp.shape)
EDA(data=pcp, save=False).heatmap()
(21184, 222)

[64]:
<AxesSubplot: ylabel='Examples'>
[65]:
_ = hist(pcp.skew().values.reshape(-1,), bins=50)
[ ]: