CAMELS Chile
![]()
![]()
This notebook explores CAMELS Chile dataset which was introduced in Alvarez-Garreton et al., 2018.
[1]:
from ai4water.eda import EDA
from ai4water.datasets import CAMELS_CL
from ai4water.utils.utils import get_version_info

import pandas as pd
import numpy as np

import matplotlib.pyplot as plt

from easy_mpl import hist, ridge
from easy_mpl import scatter
from easy_mpl.utils import process_cbar
**********Tensorflow models could not be imported **********
C:\Users\ather\.conda\envs\cat_aware\lib\site-packages\sklearn\experimental\enable_hist_gradient_boosting.py:15: UserWarning: Since version 1.0, it is not needed to import enable_hist_gradient_boosting anymore. HistGradientBoostingClassifier and HistGradientBoostingRegressor are now stable and can be normally imported from sklearn.ensemble.
  warnings.warn(
[2]:
for k,v in get_version_info().items():
    print(k, v)
python 3.8.17 (default, Jul  5 2023, 20:44:21) [MSC v.1916 64 bit (AMD64)]
os nt
ai4water 1.07
easy_mpl 0.21.3
SeqMetrics 1.3.4
numpy 1.24.3
pandas 1.3.4
matplotlib 3.6.0
sklearn 1.3.0
xarray 0.20.1
netCDF4 1.5.7
seaborn 0.12.2
[3]:
dataset = CAMELS_CL(
    path=r"E:\data\gscad\CAMELS\CAMELS_CL"    # set path to None if you have not already downloaded data
)
[4]:
dataset.start
[4]:
'19130215'
[5]:
dataset.end
[5]:
'20180309'
[6]:
stations = dataset.stations()
len(stations)
[6]:
516
Static Data
[7]:
dataset.static_features
[7]:
['gauge_name',
 'gauge_lat',
 'gauge_lon',
 'record_period_start',
 'record_period_end',
 'n_obs',
 'area',
 'elev_gauge',
 'elev_mean',
 'elev_med',
 'elev_max',
 'elev_min',
 'slope_mean',
 'nested_inner',
 'nested_outer',
 'location_type',
 'geol_class_1st',
 'geol_class_1st_frac',
 'geol_class_2nd',
 'geol_class_2nd_frac',
 'carb_rocks_frac',
 'crop_frac',
 'nf_frac',
 'fp_frac',
 'grass_frac',
 'shrub_frac',
 'wet_frac',
 'imp_frac',
 'lc_barren',
 'snow_frac',
 'lc_glacier',
 'fp_nf_index',
 'forest_frac',
 'dom_land_cover',
 'dom_land_cover_frac',
 'land_cover_missing',
 'p_mean_cr2met',
 'p_mean_chirps',
 'p_mean_mswep',
 'p_mean_tmpa',
 'pet_mean',
 'aridity_cr2met',
 'aridity_chirps',
 'aridity_mswep',
 'aridity_tmpa',
 'p_seasonality_cr2met',
 'p_seasonality_chirps',
 'p_seasonality_mswep',
 'p_seasonality_tmpa',
 'frac_snow_cr2met',
 'frac_snow_chirps',
 'frac_snow_mswep',
 'frac_snow_tmpa',
 'high_prec_freq_cr2met',
 'high_prec_freq_chirps',
 'high_prec_freq_mswep',
 'high_prec_freq_tmpa',
 'high_prec_dur_cr2met',
 'high_prec_dur_chirps',
 'high_prec_dur_mswep',
 'high_prec_dur_tmpa',
 'high_prec_timing_cr2met',
 'high_prec_timing_chirps',
 'high_prec_timing_mswep',
 'high_prec_timing_tmpa',
 'low_prec_freq_cr2met',
 'low_prec_freq_chirps',
 'low_prec_freq_mswep',
 'low_prec_freq_tmpa',
 'low_prec_dur_cr2met',
 'low_prec_dur_chirps',
 'low_prec_dur_mswep',
 'low_prec_dur_tmpa',
 'low_prec_timing_cr2met',
 'low_prec_timing_chirps',
 'low_prec_timing_mswep',
 'low_prec_timing_tmpa',
 'p_mean_spread',
 'q_mean',
 'runoff_ratio_cr2met',
 'runoff_ratio_chirps',
 'runoff_ratio_mswep',
 'runoff_ratio_tmpa',
 'stream_elas_cr2met',
 'stream_elas_chirps',
 'stream_elas_mswep',
 'stream_elas_tmpa',
 'slope_fdc',
 'baseflow_index',
 'hfd_mean',
 'Q95',
 'Q5',
 'high_q_freq',
 'high_q_dur',
 'low_q_freq',
 'low_q_dur',
 'zero_q_freq',
 'swe_ratio',
 'sur_rights_n',
 'sur_rights_flow',
 'interv_degree',
 'gw_rights_n',
 'gw_rights_flow',
 'big_dam']
[8]:
coords = dataset.stn_coords()
coords
[8]:
| lat | long | |
|---|---|---|
| 8220009 | -36.7956 | -72.9492 |
| 10362001 | -40.6181 | -73.0594 |
| 7317005 | -35.8842 | -71.0192 |
| 2112005 | -21.7125 | -69.5167 |
| 5746001 | -33.6614 | -71.3372 |
| ... | ... | ... |
| 5101001 | -32.0708 | -70.7564 |
| 10401001 | -40.5833 | -73.6000 |
| 2110002 | -22.4469 | -68.8775 |
| 8350001 | -38.2142 | -71.8283 |
| 11315001 | -45.5667 | -72.0833 |
516 rows × 2 columns
[9]:
dataset.plot_stations()
[9]:
<AxesSubplot: >
[9]:
static = dataset.fetch_static_features(stn_id=stations)
static.shape
[9]:
(516, 104)
[10]:
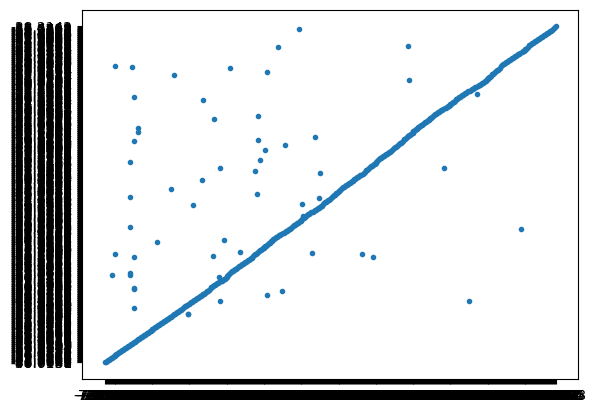
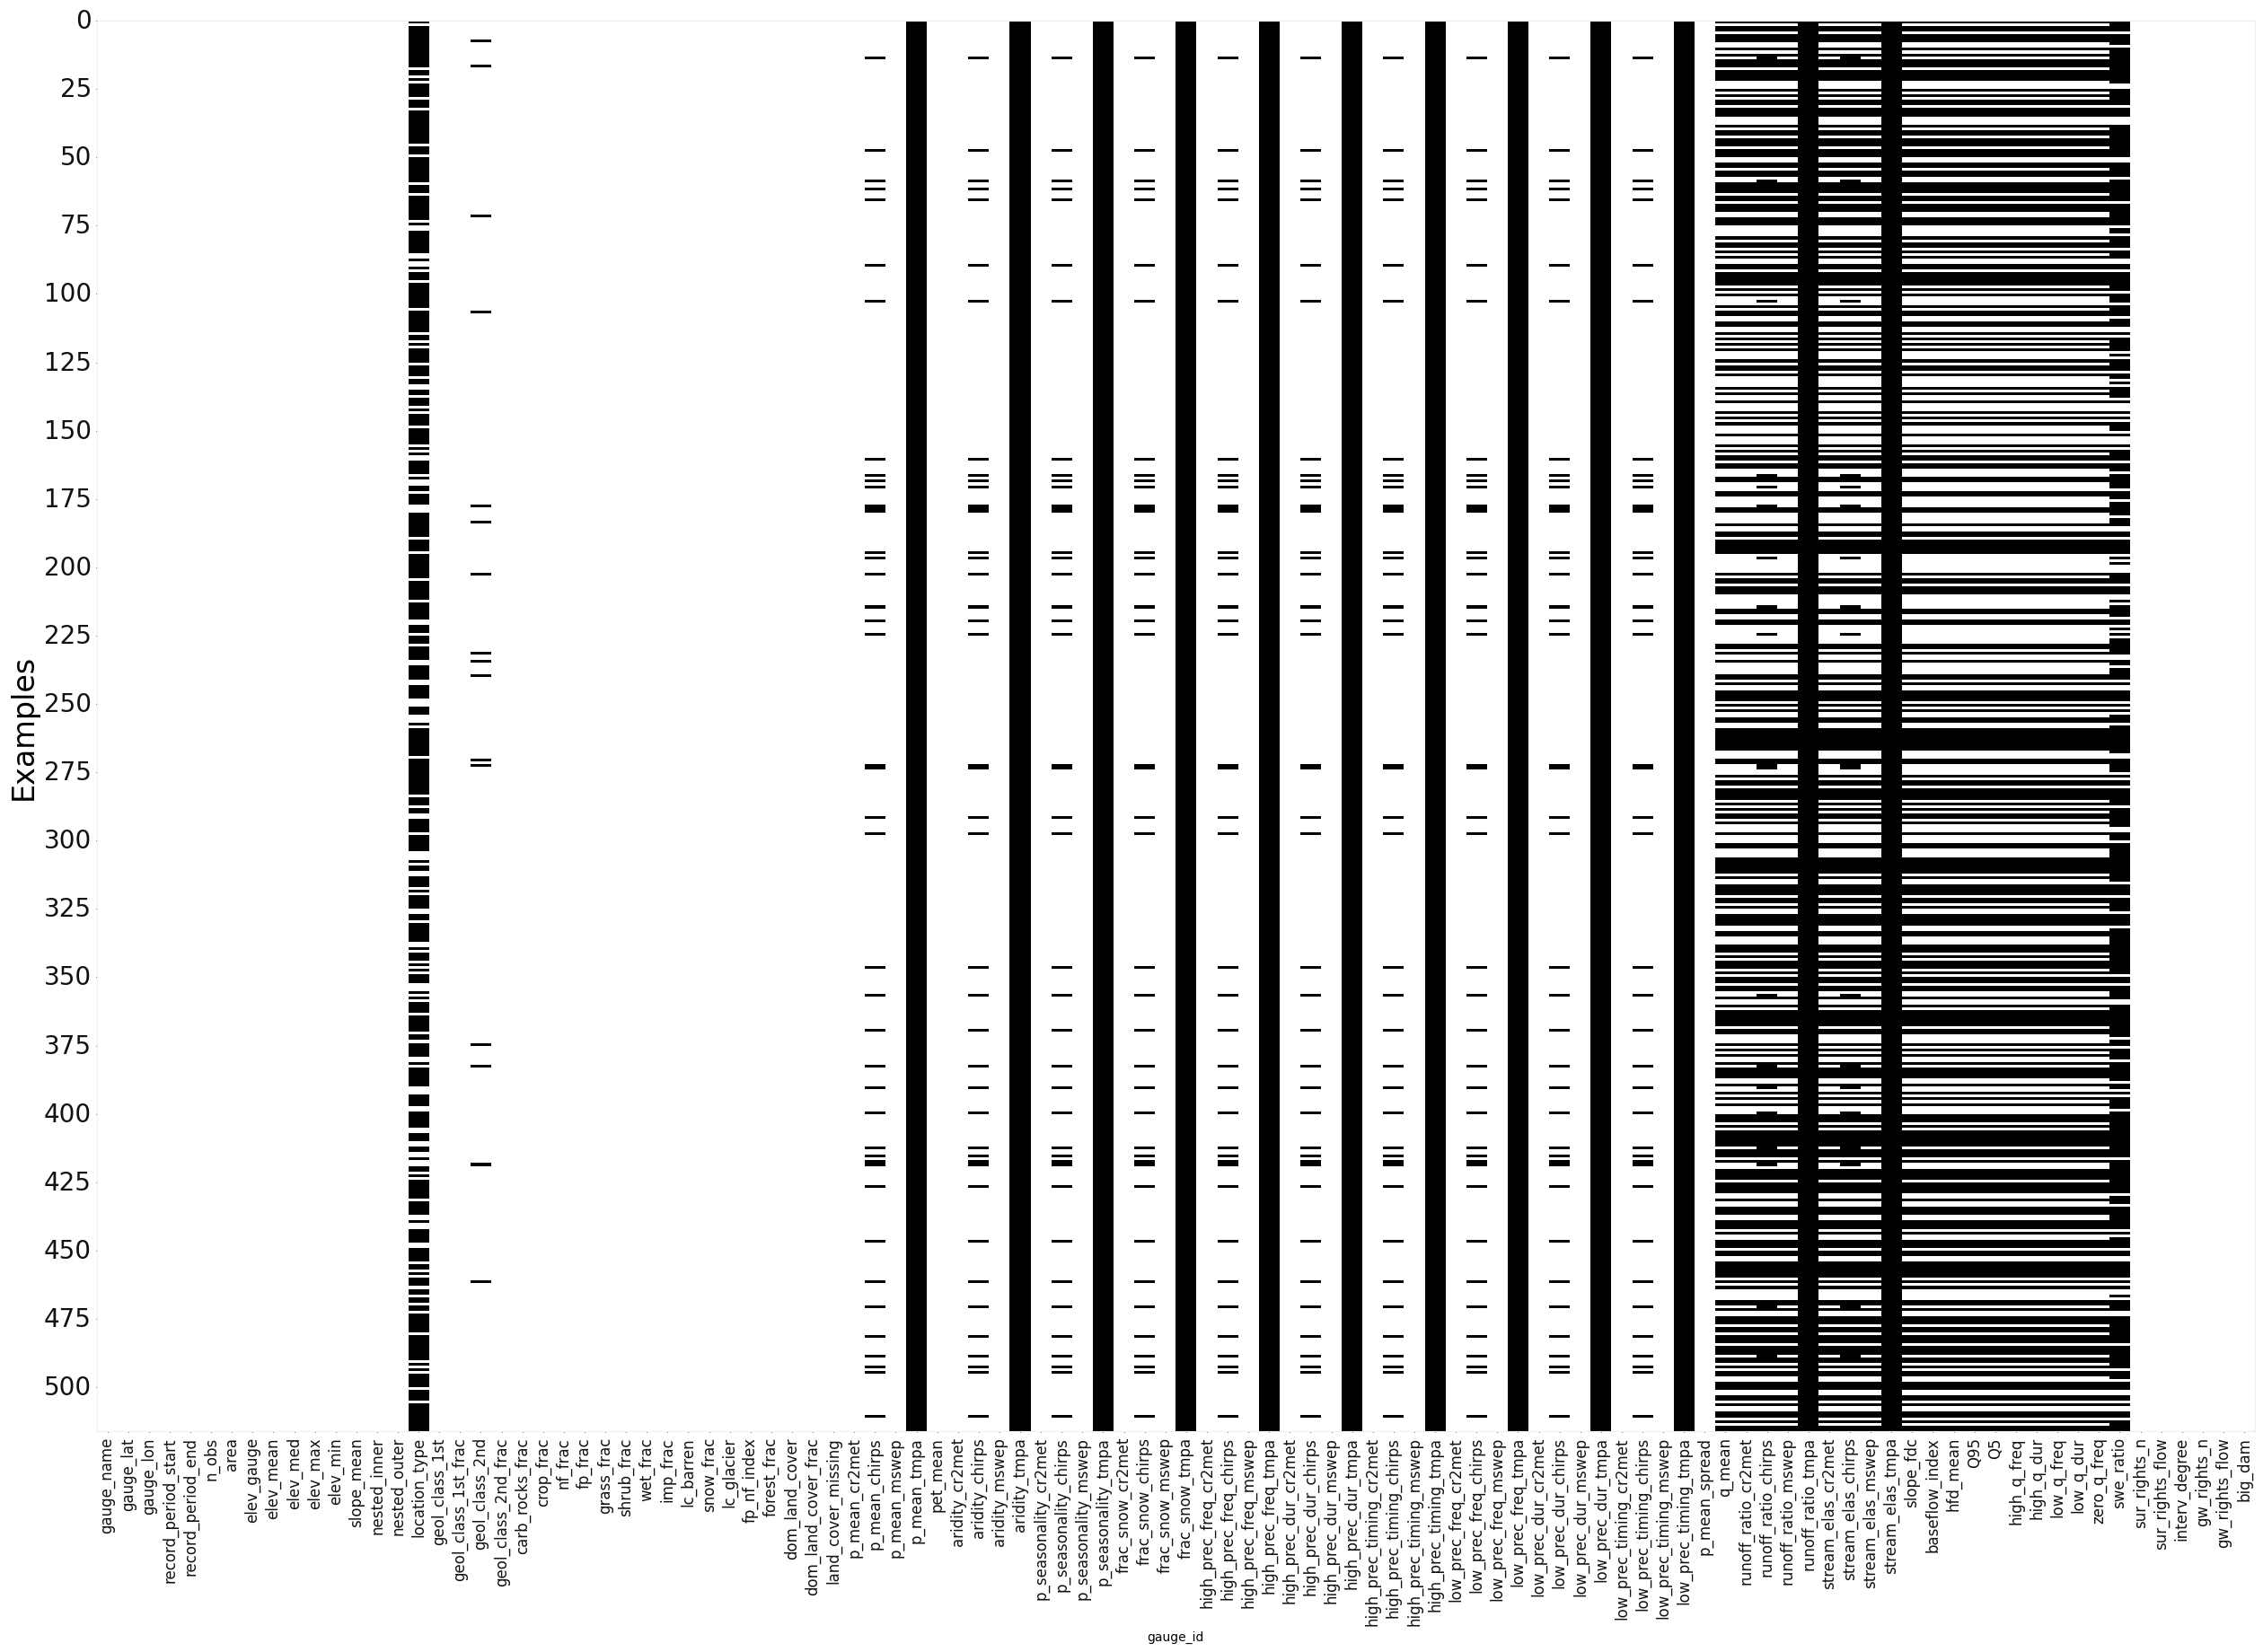
EDA(data=static, save=False).heatmap()
[10]:
<AxesSubplot: xlabel='gauge_id', ylabel='Examples'>
[11]:
static = static.dropna(axis=1)
static.shape
[11]:
(516, 62)
[12]:
physical_features = []
soil_features = []
geological_features = []
flow_characteristics = []
[13]:
lat = static['gauge_lat'].values.reshape(-1,)
long = static['gauge_lon'].values.reshape(-1,)
[14]:
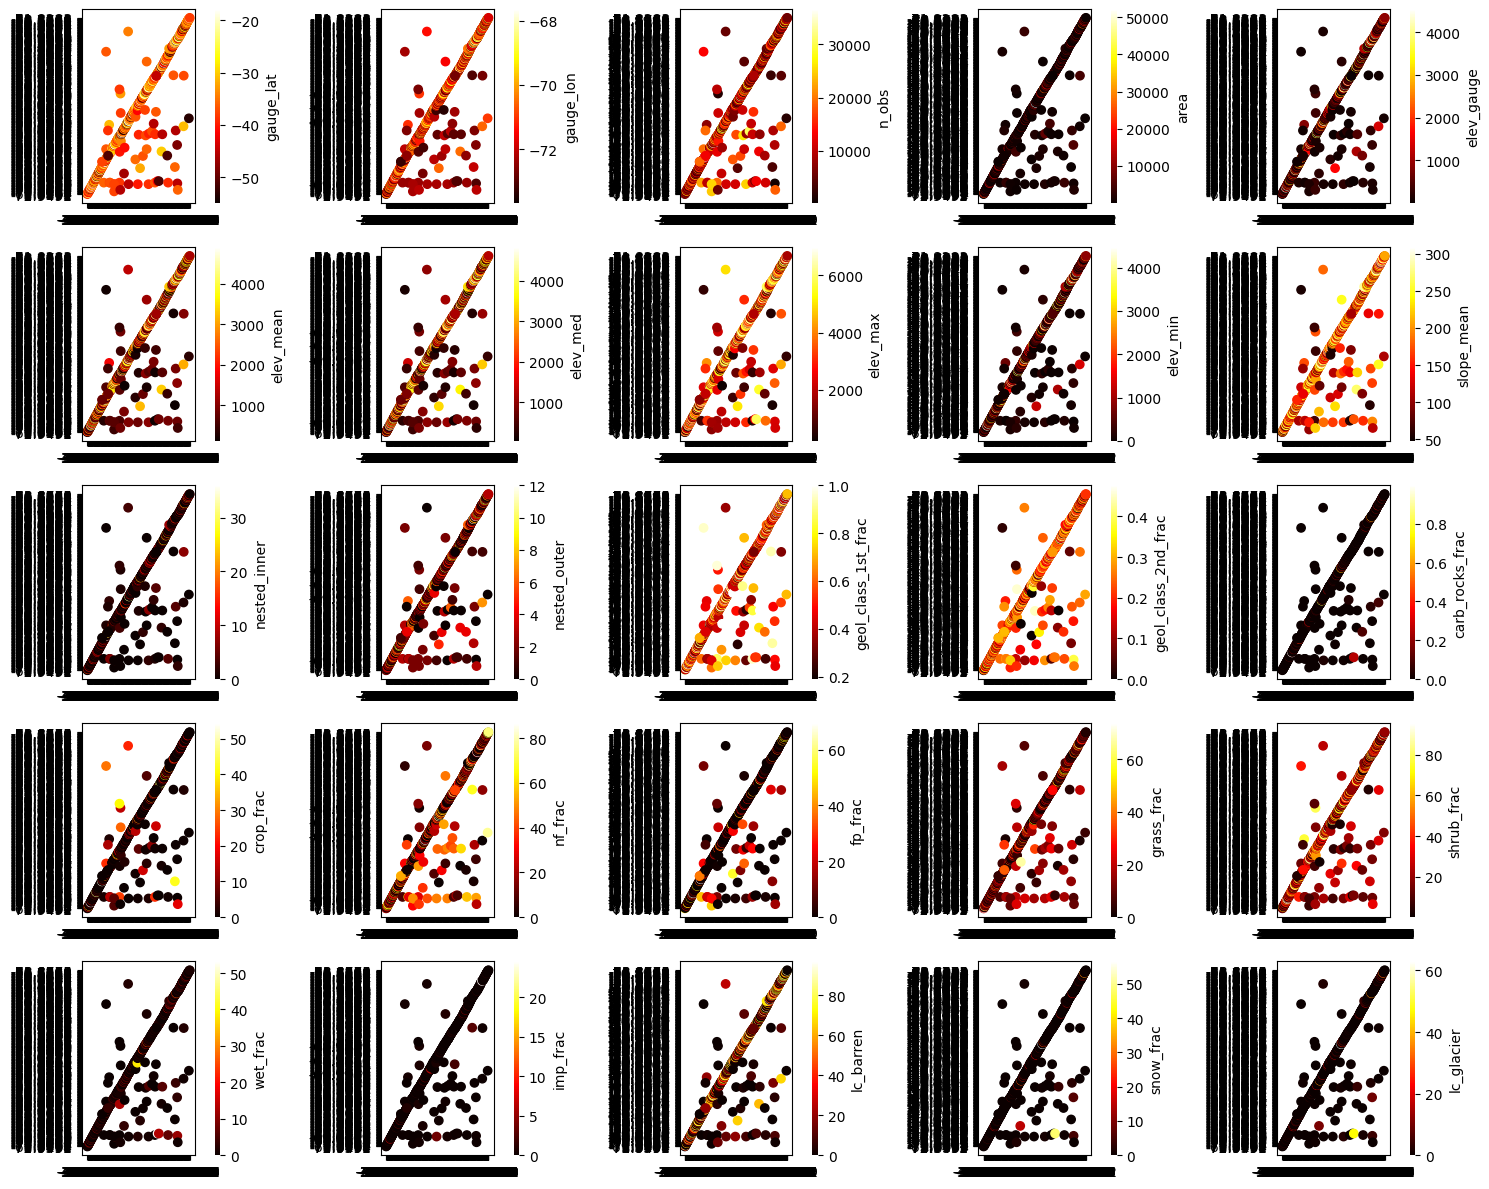
idx = 0
ax_num = 0

fig, axes = plt.subplots(5, 5, figsize=(15, 12))
axes = axes.flatten()

while ax_num < 25 and idx<static.shape[1]:

    val = static.iloc[:, idx]
    idx += 1

    try:
        c = val.astype(float).values.reshape(-1,)

        en = static.shape[0]
        ax = axes[ax_num]
        ax, sc = scatter(lat[0:en], long[0:en], c=c[0:en], cmap="hot", show=False, ax=ax)

        process_cbar(ax, sc, border=False, title=val.name, #title_kws ={"fontsize": 14}
                    )
        ax_num += 1
    except ValueError:
        continue


print(idx)
plt.tight_layout()
plt.show()
29
[15]:
idx = 29
ax_num = 0

fig, axes = plt.subplots(5, 5, figsize=(15, 12))
axes = axes.flatten()

while ax_num < 25 and idx<static.shape[1]:

    val = static.iloc[:, idx]
    idx += 1

    try:
        c = val.astype(float).values.reshape(-1,)

        en = static.shape[0]
        ax = axes[ax_num]
        ax, sc = scatter(lat[0:en], long[0:en], c=c[0:en], cmap="hot", show=False, ax=ax)

        process_cbar(ax, sc, border=False, title=val.name, #title_kws ={"fontsize": 14}
                    )
        ax_num += 1
    except ValueError:
        continue


plt.tight_layout()
plt.show()
print(idx)
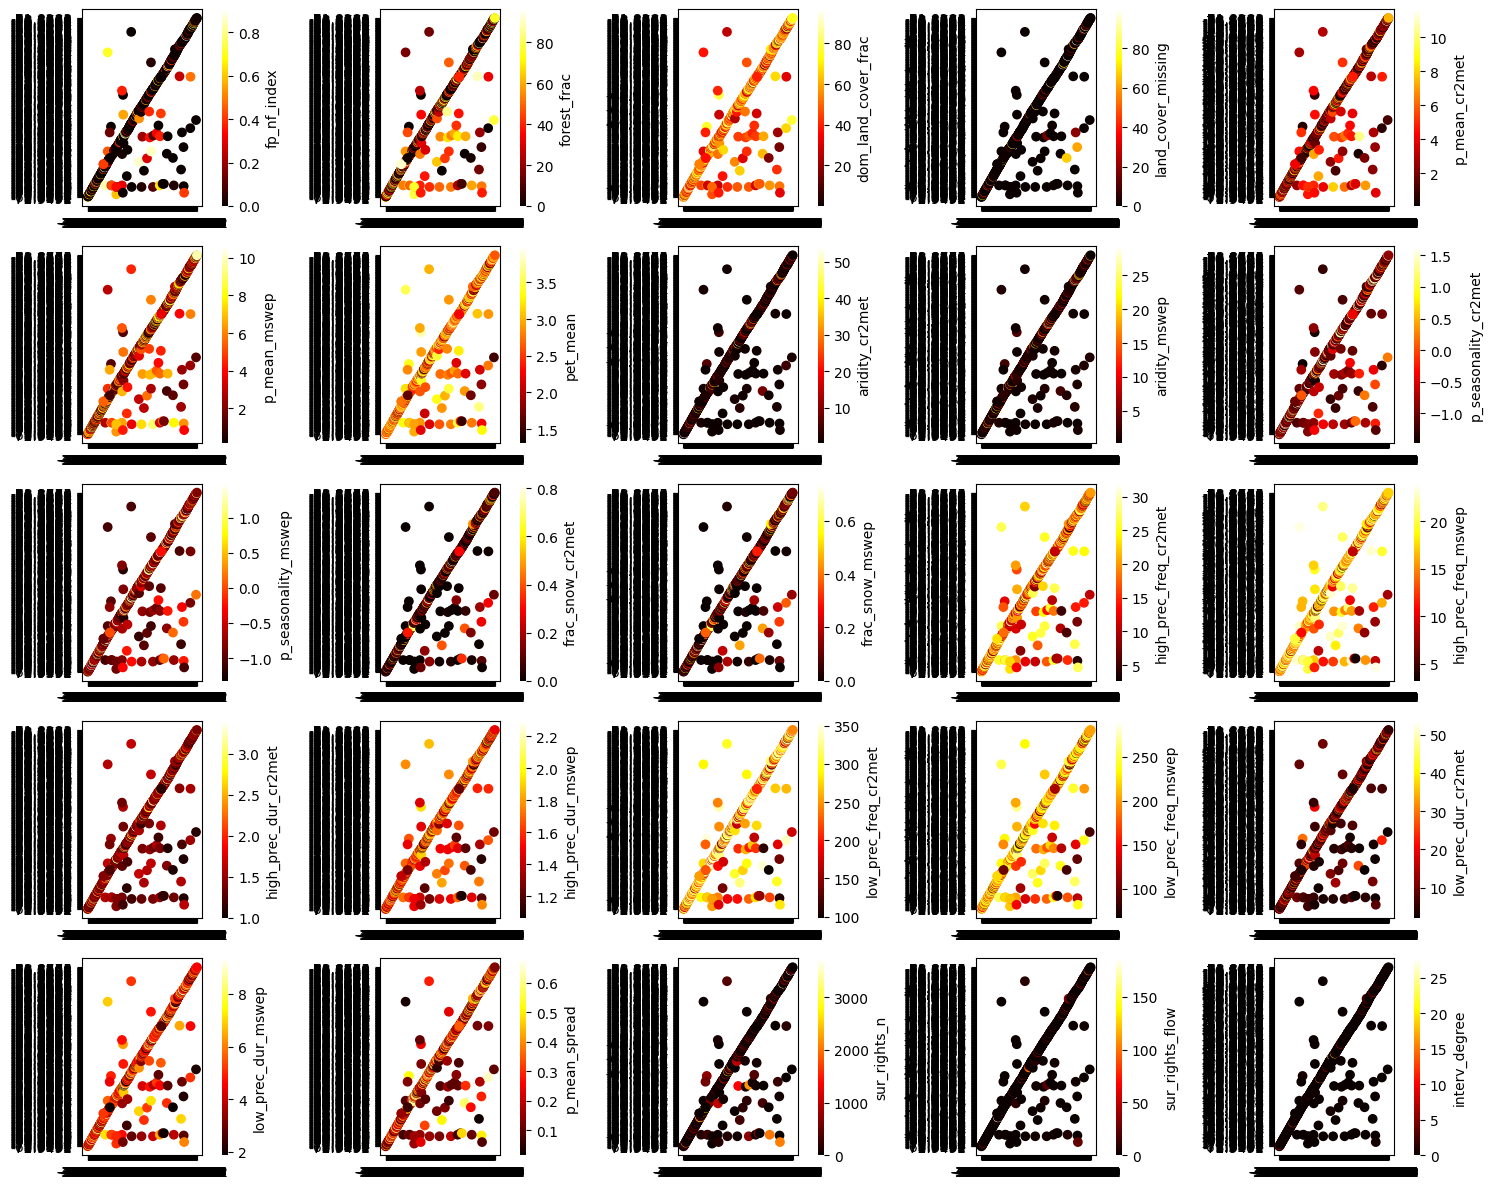
59
[16]:
print(idx)
#val.astype('float')
#scatter(lat.values, long.values, c=val.astype('float').values.reshape(-1,))
val
59
[16]:
8220009      0.011646446291
10362001     0.054343679672
7317005      0.000398868526
2112005      9.782030175986
5746001      0.222243088105
                 ...
5101001      0.000000000000
10401001     0.039348651098
2110002      1.910341017694
8350001      0.000000000000
11315001     0.022692805213
Name: interv_degree, Length: 516, dtype: object
Dynamic Features
[4]:
dataset.dynamic_features
[4]:
['streamflow_m3s',
 'streamflow_mm',
 'precip_cr2met',
 'precip_chirps',
 'precip_mswep',
 'precip_tmpa',
 'tmin_cr2met',
 'tmax_cr2met',
 'tmean_cr2met',
 'pet_8d_modis',
 'pet_hargreaves',
 'swe']
[5]:
# difference betwen different pcp ???
# meaning of gleam ???
Streamflow
[10]:
streamflow = dataset.q_mmd()
print(streamflow.shape)
_ = EDA(data=streamflow, save=False).heatmap()
(38374, 516)
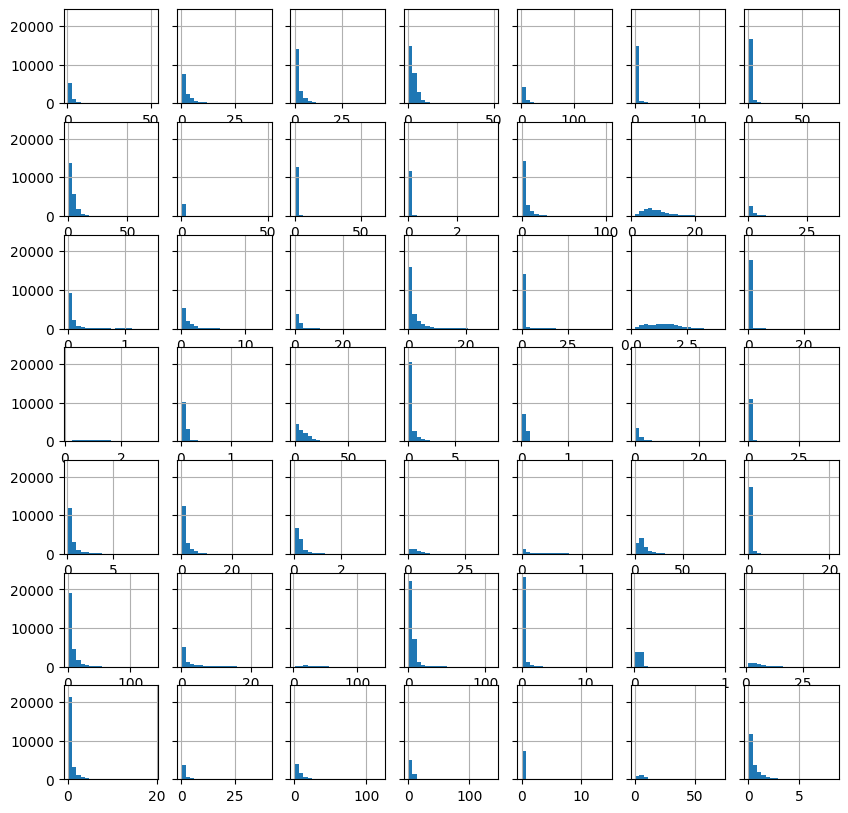
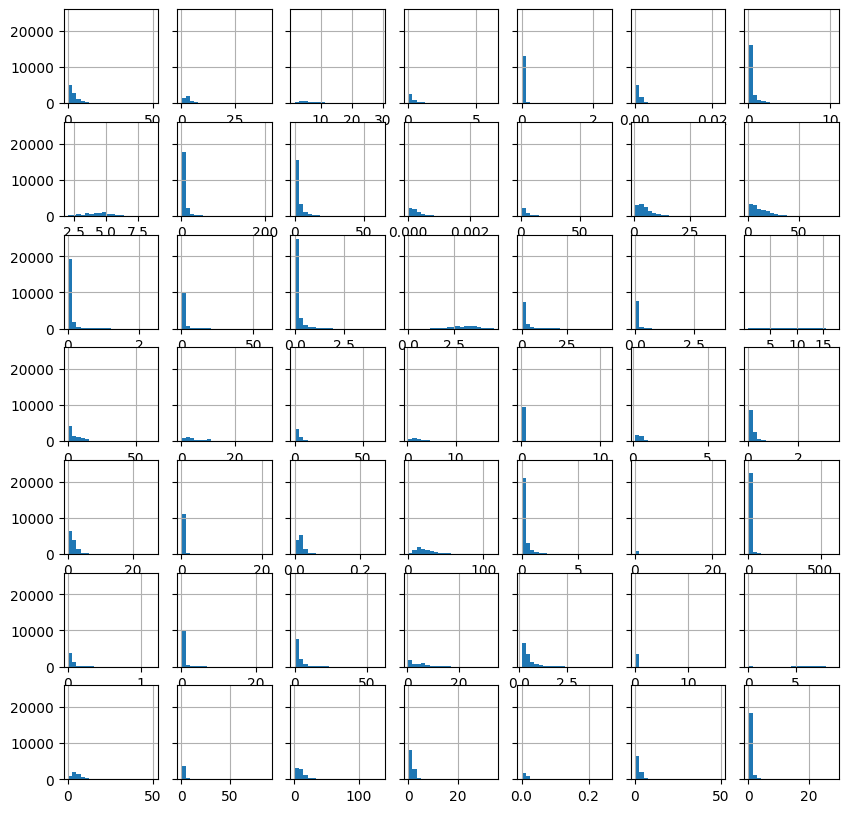
[11]:
st = 0

fig, axes = plt.subplots(7, 7, figsize=(10, 10), sharey="all")

idx = st
for _, ax in enumerate(axes.flat):

    hist(streamflow.iloc[:, idx].values.reshape(-1,),
         bins=20,
         ax=ax,
         show=False
        )

    idx += 1

plt.show()
print(idx)
49
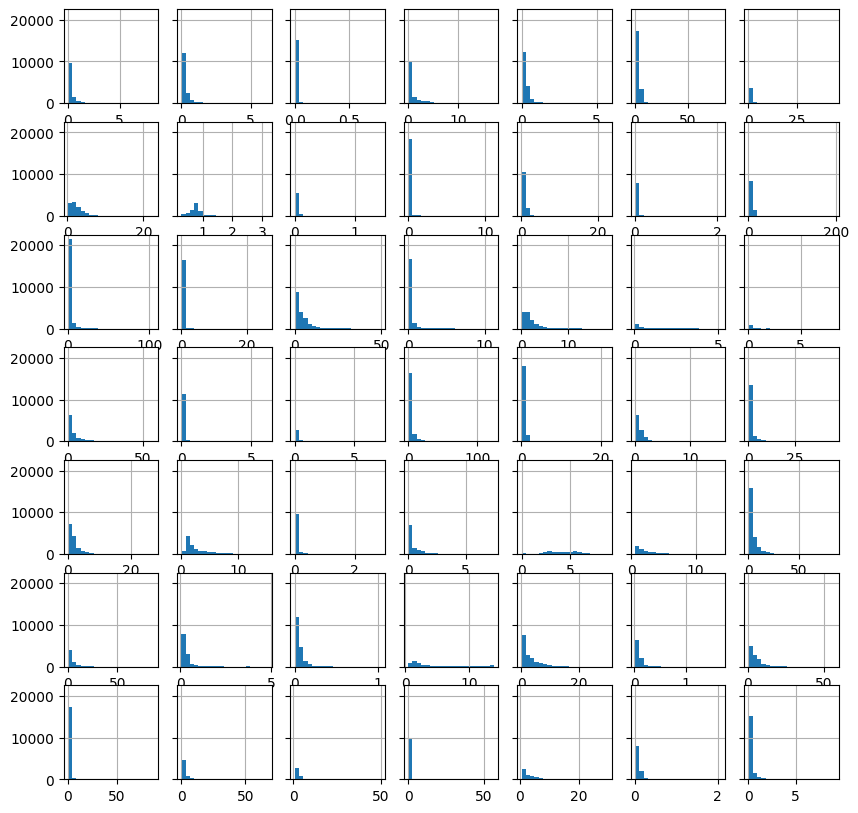
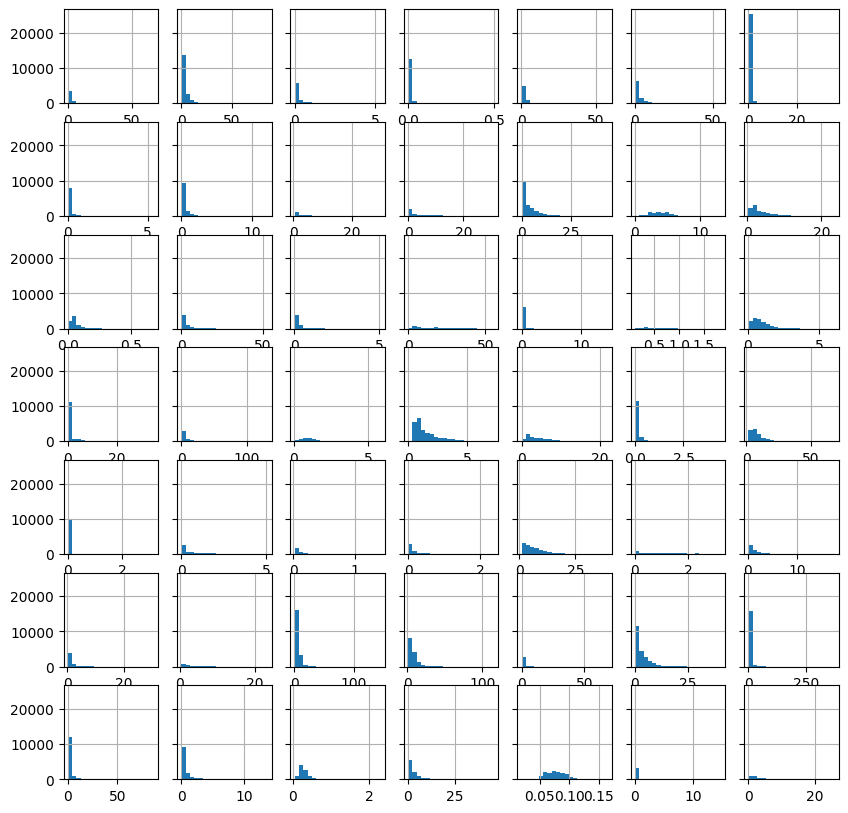
[12]:
st = 49

fig, axes = plt.subplots(7, 7, figsize=(10, 10), sharey="all")

idx = st
for _, ax in enumerate(axes.flat):

    hist(streamflow.iloc[:, idx].values.reshape(-1,),
         bins=20,
         ax=ax,
         show=False
        )

    idx += 1

plt.show()
print(idx)
98
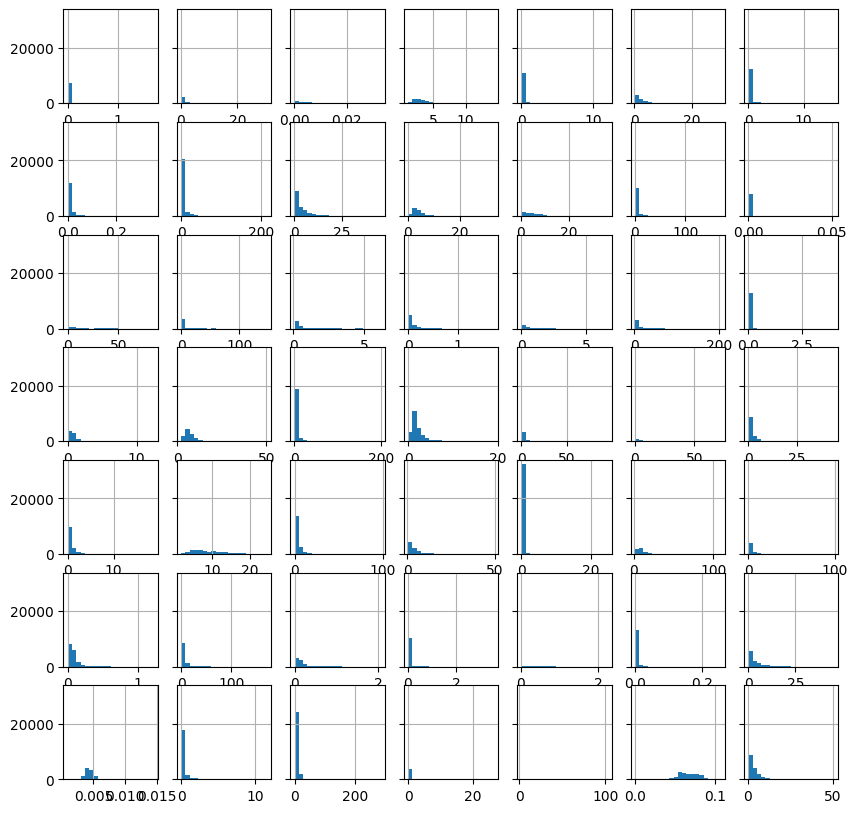
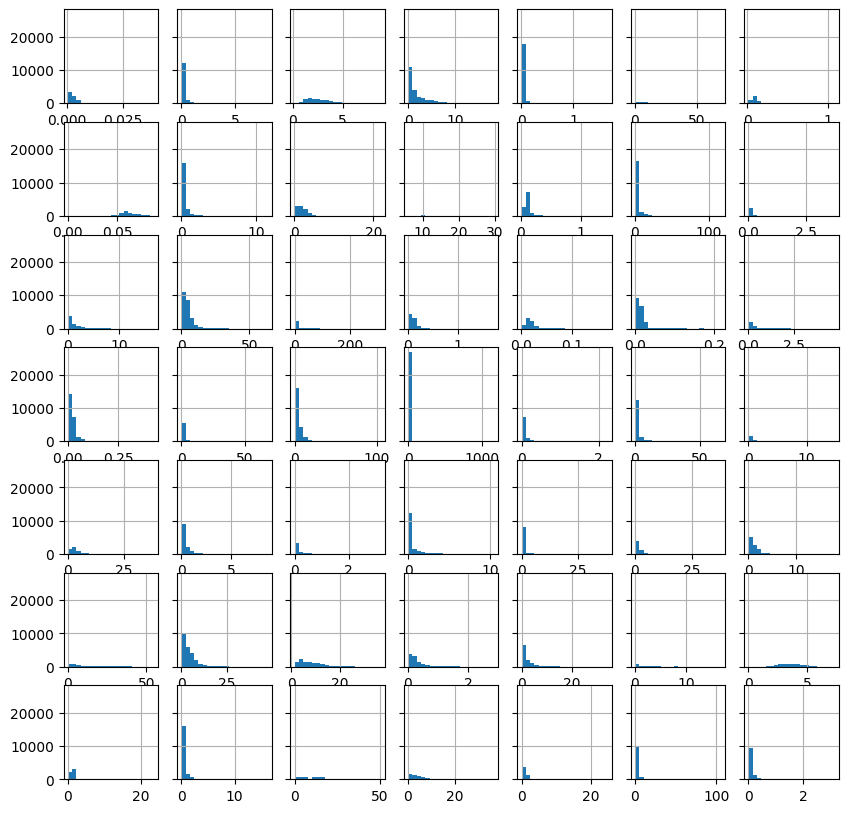
[13]:
st = 98

fig, axes = plt.subplots(7, 7, figsize=(10, 10), sharey="all")

idx = st
for _, ax in enumerate(axes.flat):

    hist(streamflow.iloc[:, idx].values.reshape(-1,),
         bins=20,
         ax=ax,
         show=False
        )

    idx += 1

plt.show()
print(idx)
147
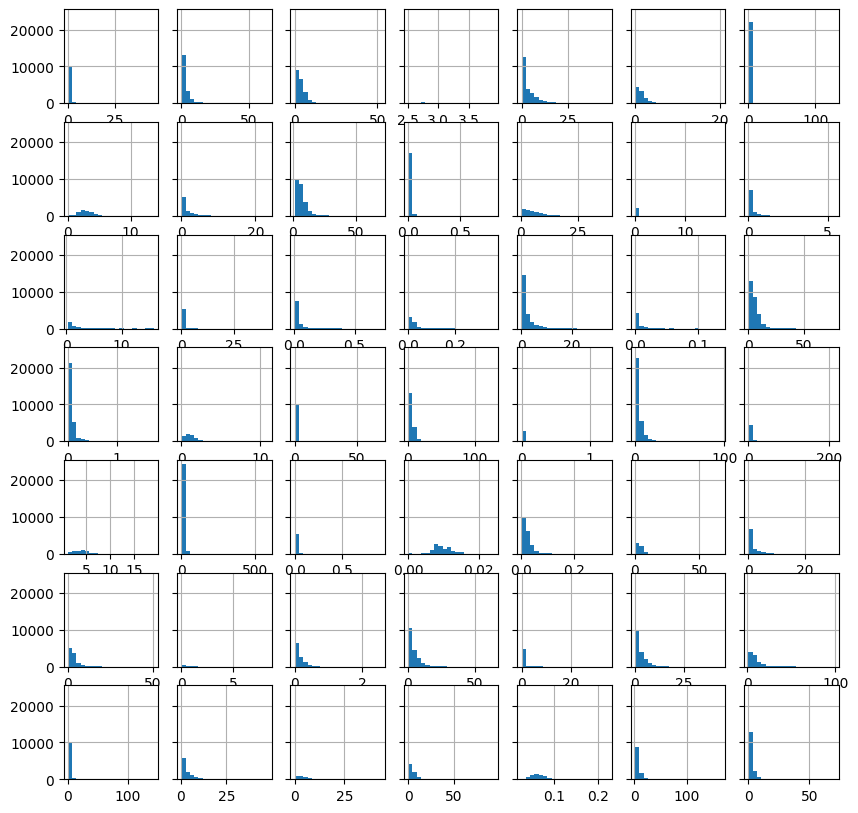
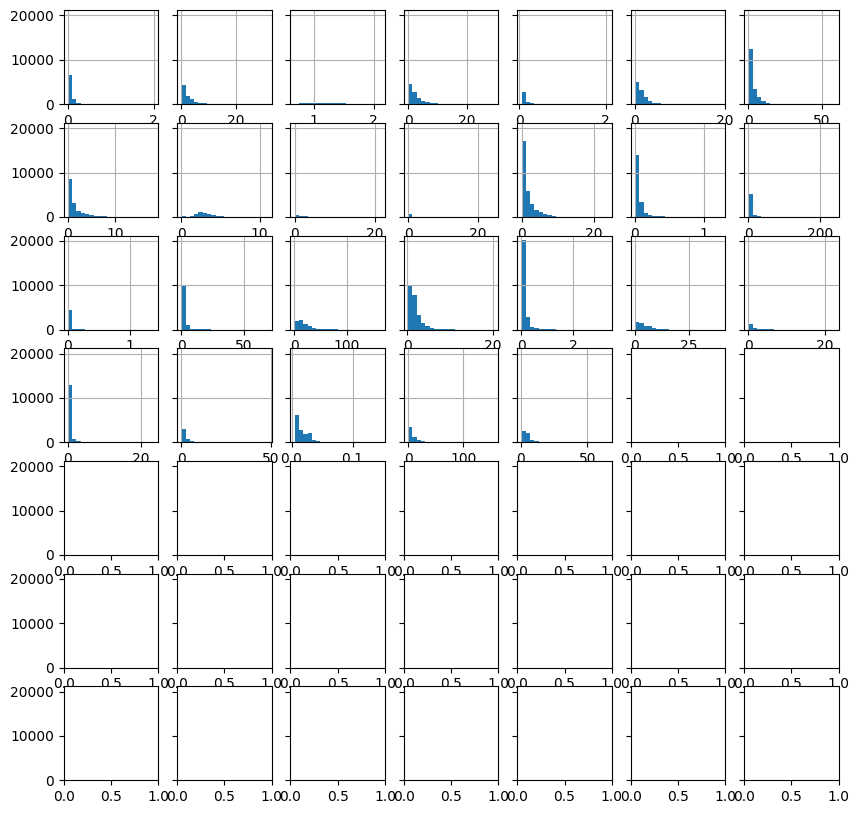
[14]:
st = 147

fig, axes = plt.subplots(7, 7, figsize=(10, 10), sharey="all")

idx = st
for _, ax in enumerate(axes.flat):

    hist(streamflow.iloc[:, idx].values.reshape(-1,),
         bins=20,
         ax=ax,
         show=False
        )

    idx += 1

plt.show()
print(idx)
196
[15]:
st = 196

fig, axes = plt.subplots(7, 7, figsize=(10, 10), sharey="all")

idx = st
for _, ax in enumerate(axes.flat):


    hist(streamflow.iloc[:, idx].values.reshape(-1,),
     bins=20,
     ax=ax,
     show=False
    )

    idx += 1

plt.show()
print(idx)
245
[16]:
st = 245

fig, axes = plt.subplots(7, 7, figsize=(10, 10), sharey="all")

idx = st
for _, ax in enumerate(axes.flat):


    hist(streamflow.iloc[:, idx].values.reshape(-1,),
     bins=20,
     ax=ax,
     show=False
    )

    idx += 1

plt.show()
print(idx)
294
[17]:
st = 294

fig, axes = plt.subplots(7, 7, figsize=(10, 10), sharey="all")

idx = st
for _, ax in enumerate(axes.flat):


    hist(streamflow.iloc[:, idx].values.reshape(-1,),
     bins=20,
     ax=ax,
     show=False
    )

    idx += 1

plt.show()
print(idx)
343
[18]:
st = 343

fig, axes = plt.subplots(7, 7, figsize=(10, 10), sharey="all")

idx = st
for _, ax in enumerate(axes.flat):


    hist(streamflow.iloc[:, idx].values.reshape(-1,),
     bins=20,
     ax=ax,
     show=False
    )

    idx += 1

plt.show()
print(idx)
392
[19]:
st = 392

fig, axes = plt.subplots(7, 7, figsize=(10, 10), sharey="all")

idx = st
for _, ax in enumerate(axes.flat):


    hist(streamflow.iloc[:, idx].values.reshape(-1,),
     bins=20,
     ax=ax,
     show=False
    )

    idx += 1

plt.show()
print(idx)
441
[20]:
st = 441

fig, axes = plt.subplots(7, 7, figsize=(10, 10), sharey="all")

idx = st
for _, ax in enumerate(axes.flat):


    hist(streamflow.iloc[:, idx].values.reshape(-1,),
     bins=20,
     ax=ax,
     show=False
    )

    idx += 1

plt.show()
print(idx)
490
[21]:
st = 490

fig, axes = plt.subplots(7, 7, figsize=(10, 10), sharey="all")

idx = st
for _, ax in enumerate(axes.flat):


    if idx>=516:
        break

    hist(streamflow.iloc[:, idx].values.reshape(-1,),
     bins=20,
     ax=ax,
     show=False
    )

    idx += 1

plt.show()
print(idx)
516
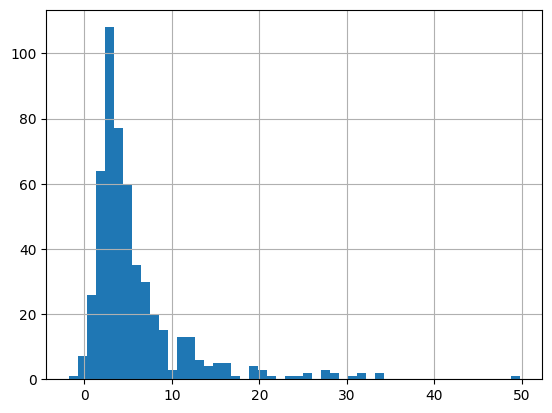
[22]:
# skewness of streamflow

_ = hist(streamflow.skew().values.reshape(-1,), bins=50)
potential evapotranspiration
[20]:
pet = dataset.fetch(dynamic_features = 'pet_hargreaves', as_dataframe=True)
pet = pet.reset_index()
pet.index = pd.to_datetime(pet.pop('time'))
pet.pop('dynamic_features')
print(pet.shape)
EDA(data=pet, save=False).heatmap()
(38374, 516)

[20]:
<AxesSubplot: ylabel='Examples'>
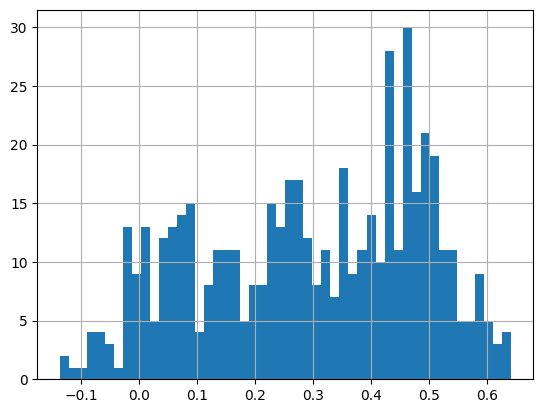
[21]:
_ = hist(pet.skew().values.reshape(-1,), bins=50)
Air Temperature
[23]:
import gc
gc.collect()
[23]:
2728
[4]:
temp = dataset.fetch(dynamic_features = 'tmean_cr2met', as_dataframe=True)
temp = temp.reset_index()
temp.index = pd.to_datetime(temp.pop('time'))
temp.pop('dynamic_features')

print(temp.shape)

EDA(data=temp, save=False).heatmap()
(38374, 516)

[4]:
<AxesSubplot: ylabel='Examples'>
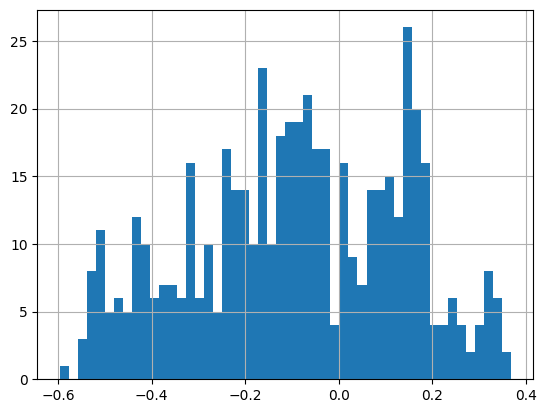
[5]:
_ = hist(temp.skew().values.reshape(-1,), bins=50)
Precipitation
[6]:
pcp = dataset.fetch(dynamic_features = 'precip_mswep', as_dataframe=True)
pcp = pcp.reset_index()
pcp.index = pd.to_datetime(pcp.pop('time'))
pcp.pop('dynamic_features')
print(pcp.shape)
EDA(data=pcp, save=False).heatmap()
(38374, 516)

[6]:
<AxesSubplot: ylabel='Examples'>
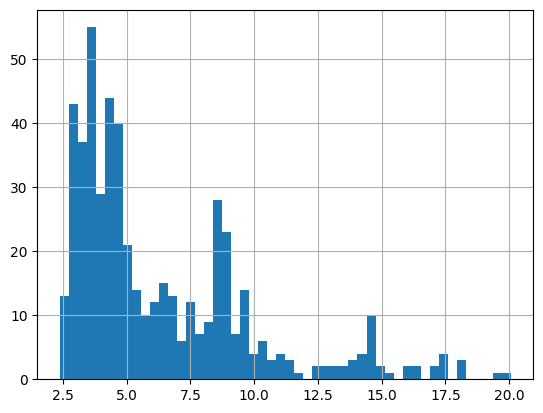
[7]:
_ = hist(pcp.skew().values.reshape(-1,), bins=50)
[ ]: