HYPE (Costa Rica)
![]()
![]()
This notebook explores HYPE-CR dataset.
[1]:
from ai4water.eda import EDA
from ai4water.datasets import HYPE
from ai4water.utils.utils import get_version_info

import pandas as pd
import numpy as np

import matplotlib.pyplot as plt

from easy_mpl import hist, ridge
from easy_mpl import scatter
from easy_mpl.utils import process_cbar
**********Tensorflow models could not be imported **********
C:\Users\ather\.conda\envs\cat_aware\lib\site-packages\sklearn\experimental\enable_hist_gradient_boosting.py:15: UserWarning: Since version 1.0, it is not needed to import enable_hist_gradient_boosting anymore. HistGradientBoostingClassifier and HistGradientBoostingRegressor are now stable and can be normally imported from sklearn.ensemble.
  warnings.warn(
[2]:
for k,v in get_version_info().items():
    print(k, v)
python 3.8.17 (default, Jul  5 2023, 20:44:21) [MSC v.1916 64 bit (AMD64)]
os nt
ai4water 1.07
easy_mpl 0.21.3
SeqMetrics 1.3.4
numpy 1.24.3
pandas 1.3.4
matplotlib 3.6.0
sklearn 1.3.0
xarray 0.20.1
netCDF4 1.5.7
seaborn 0.12.2
[3]:
dataset = HYPE(
    path=r"E:\data\gscad\CAMELS\HYPE"   # set path to None if you have not already downloaded data
)
    Not downloading the data since the directory
    E:\data\gscad\CAMELS\HYPE already exists.
    Use overwrite=True to remove previously saved files and download again
[4]:
dataset.start
[4]:
'19850101'
[5]:
dataset.end
[5]:
'20191231'
[6]:
stations = dataset.stations()
len(stations)
[6]:
564
[8]:
dataset.plot_stations()
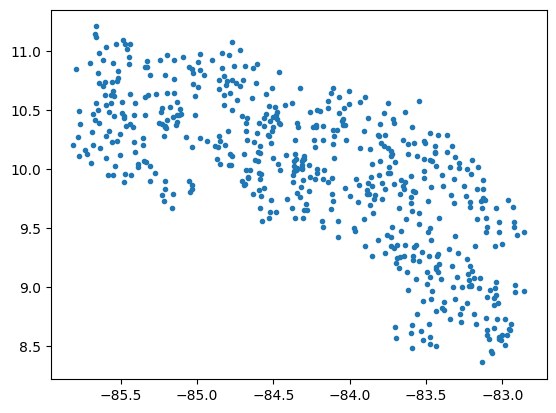
[8]:
<AxesSubplot: >
Static Data
[7]:
dataset.static_features
[7]:
[]
Dynamic Features
[11]:
dataset.dynamic_features
[11]:
['AET_mm',
 'Baseflow_mm',
 'Infiltration_mm',
 'SM_mm',
 'Streamflow_mm',
 'Runoff_mm',
 'Qsim_m3-s',
 'Prec_mm',
 'PET_mm']
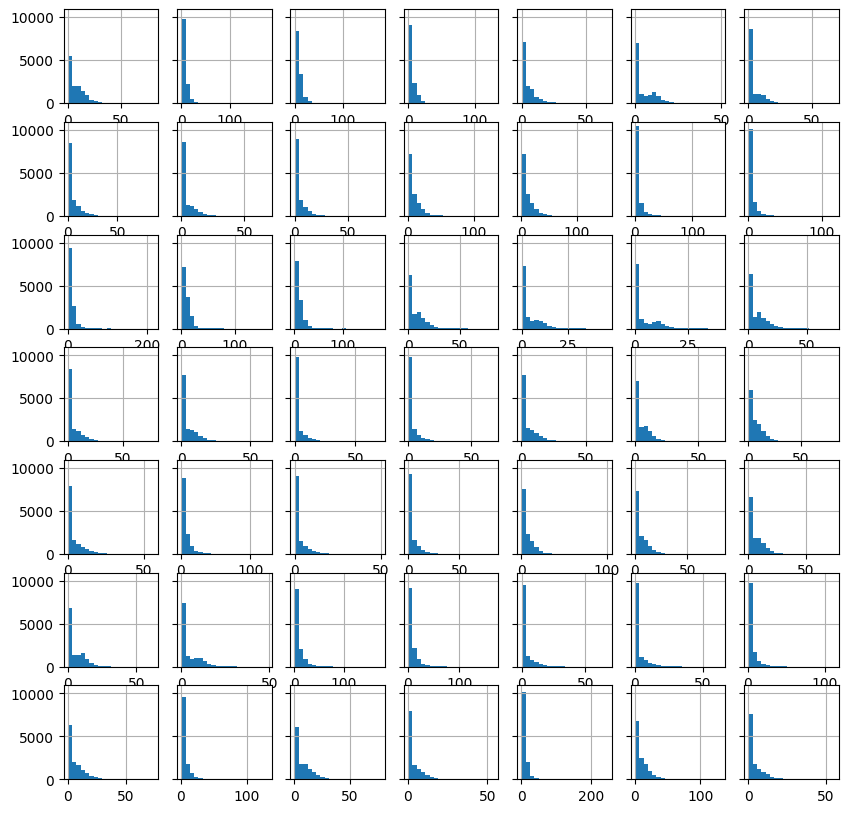
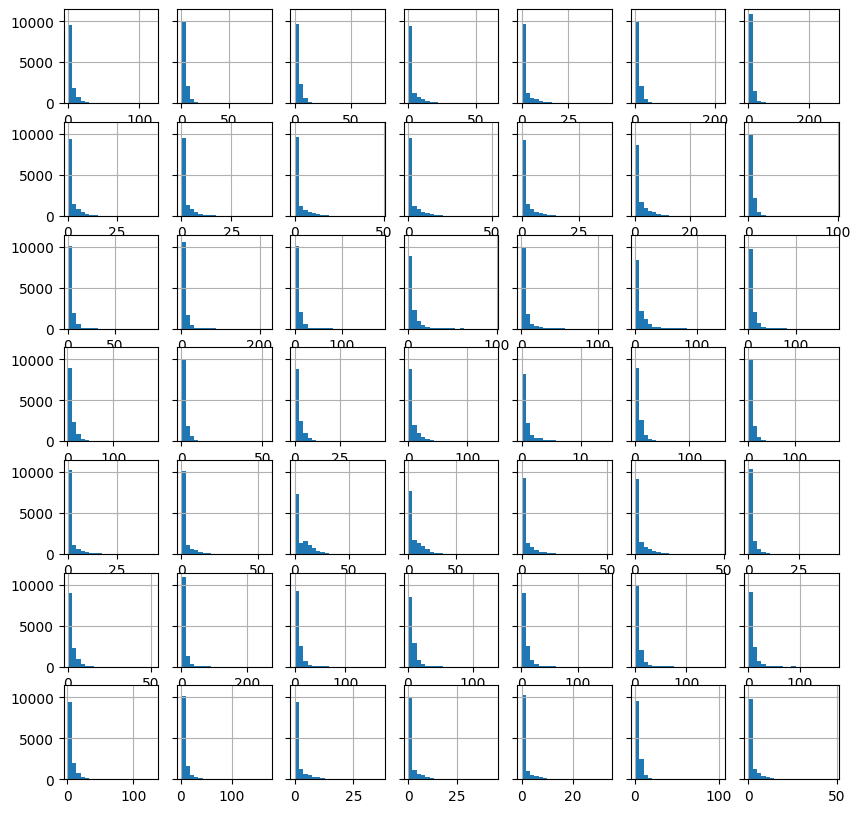
Streamflow
[9]:
streamflow = dataset.q_mmd()
streamflow.shape
[9]:
(12783, 564)
[10]:
EDA(data=streamflow, save=False).heatmap()

[10]:
<AxesSubplot: ylabel='Examples'>
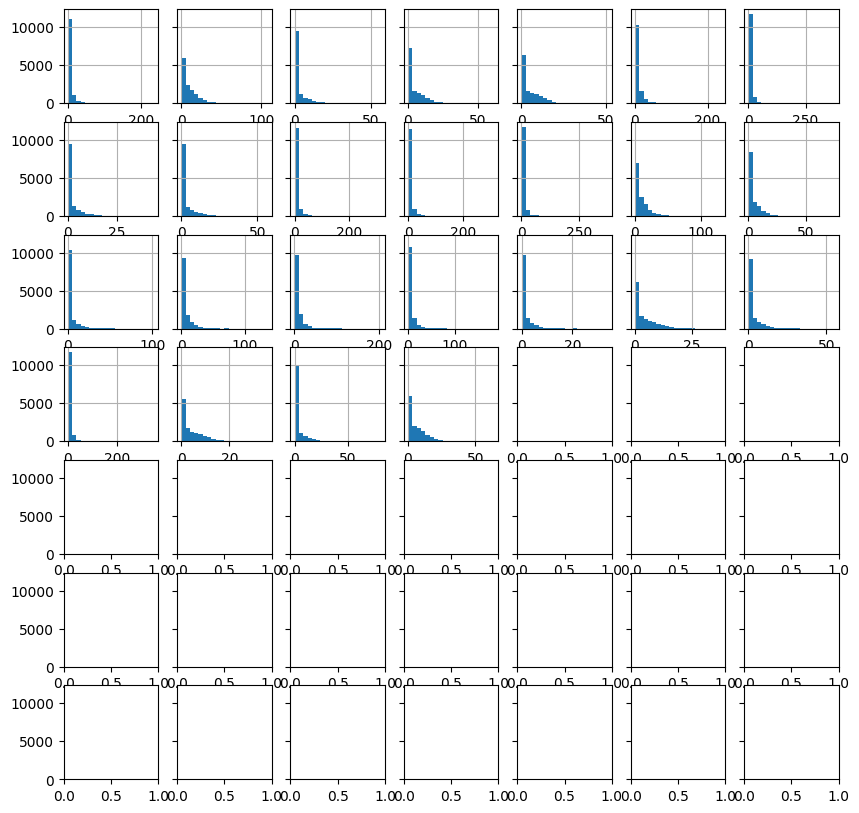
[11]:
st = 0

fig, axes = plt.subplots(7, 7, figsize=(10, 10), sharey="all")

idx = st
for _, ax in enumerate(axes.flat):

    hist(streamflow.iloc[:, idx].values.reshape(-1,),
         bins=20,
         ax=ax,
         show=False
        )

    idx += 1

plt.show()
print(idx)
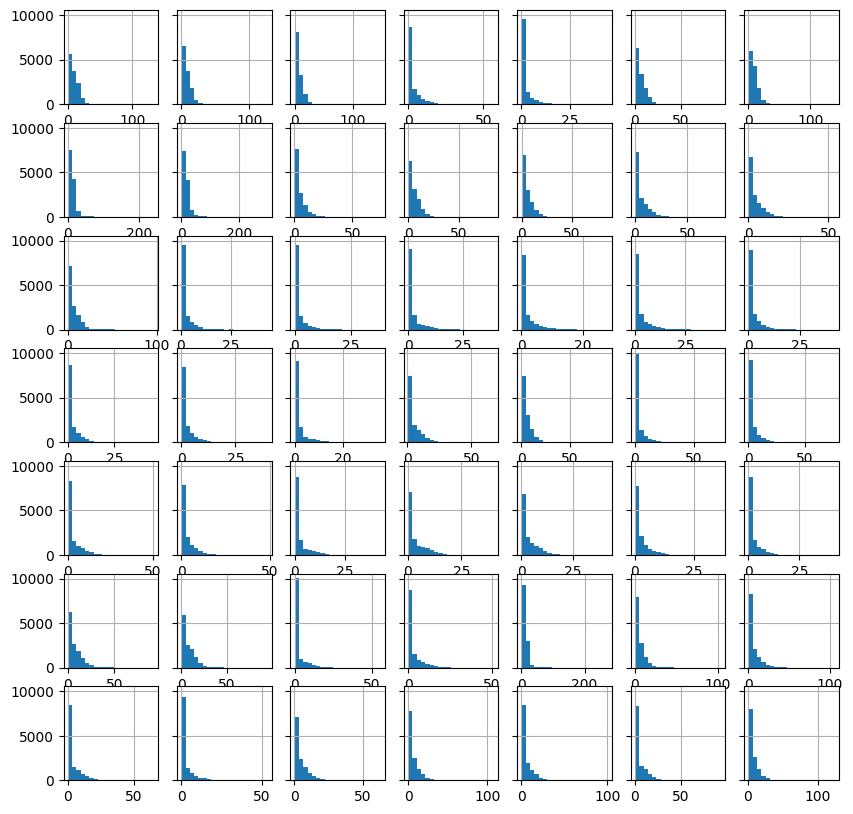
49
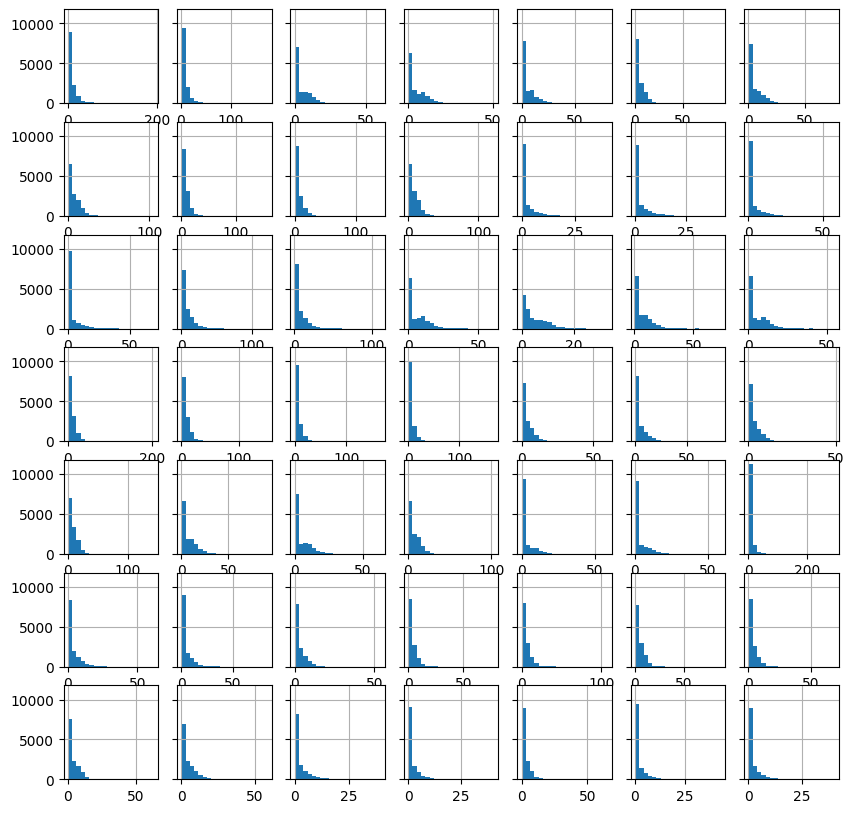
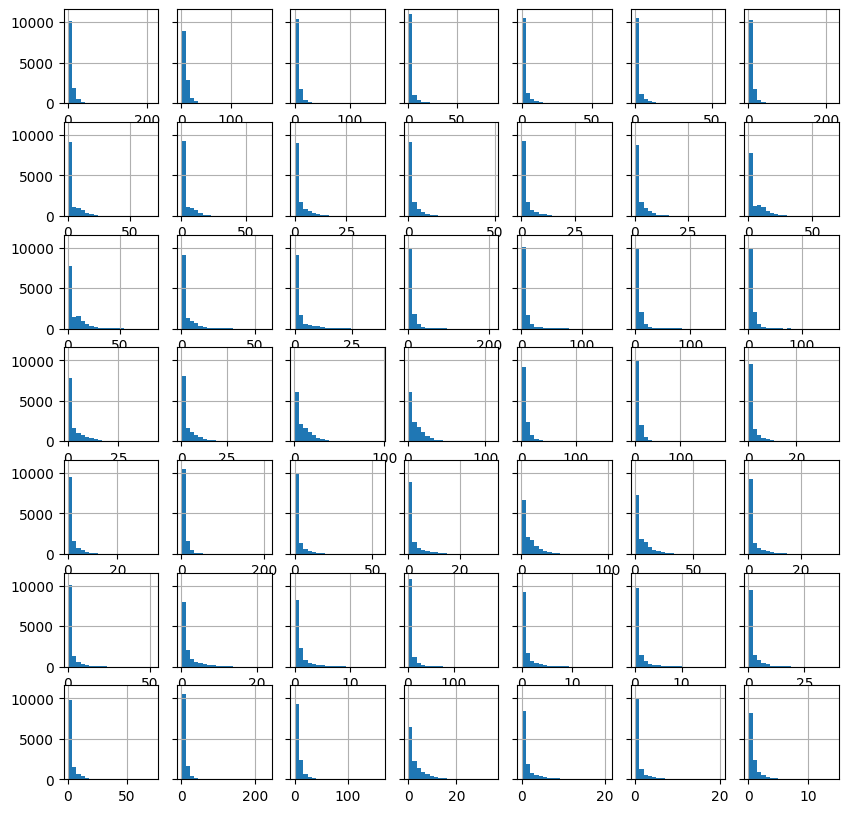
[12]:
st = 49

fig, axes = plt.subplots(7, 7, figsize=(10, 10), sharey="all")

idx = st
for _, ax in enumerate(axes.flat):

    hist(streamflow.iloc[:, idx].values.reshape(-1,),
         bins=20,
         ax=ax,
         show=False
        )

    idx += 1

plt.show()
print(idx)
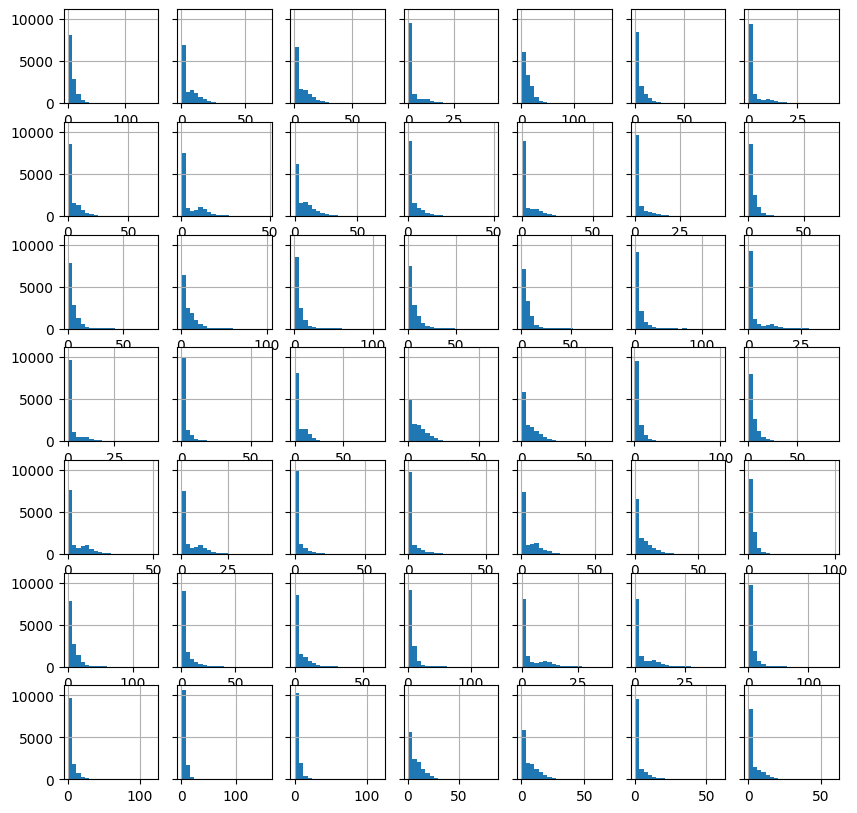
98
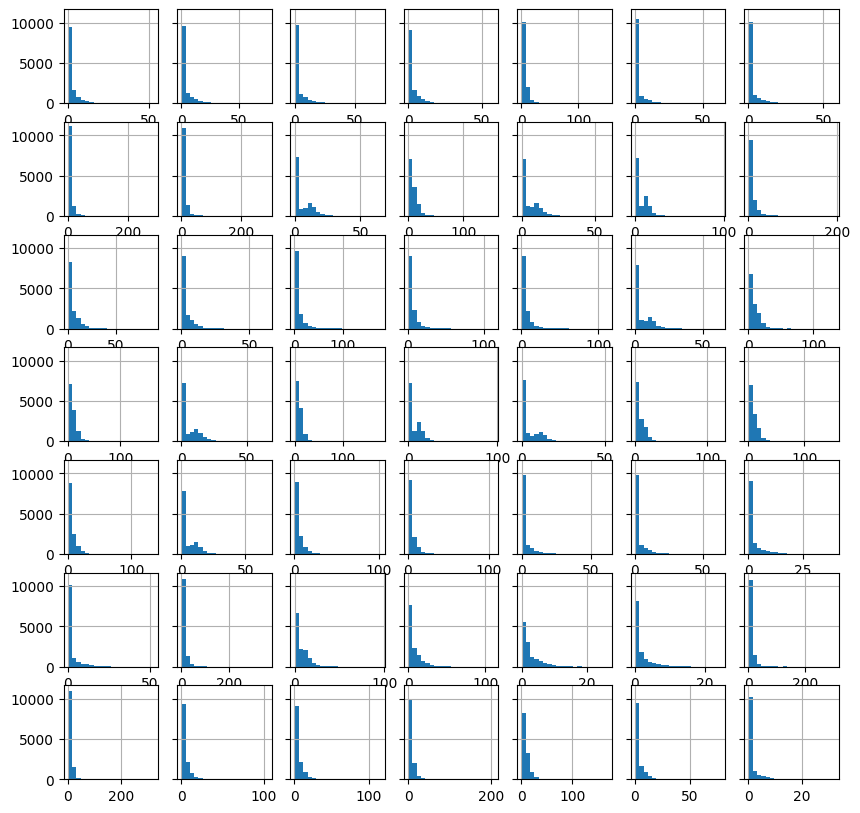
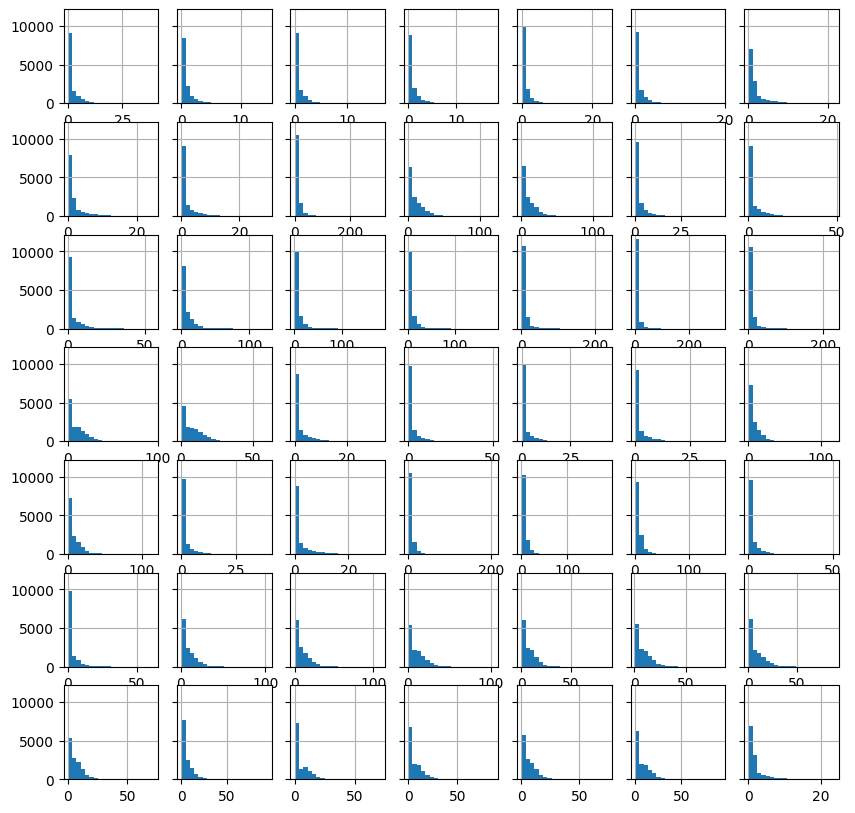
[13]:
st = 98

fig, axes = plt.subplots(7, 7, figsize=(10, 10), sharey="all")

idx = st
for _, ax in enumerate(axes.flat):

    hist(streamflow.iloc[:, idx].values.reshape(-1,),
         bins=20,
         ax=ax,
         show=False
        )

    idx += 1

plt.show()
print(idx)
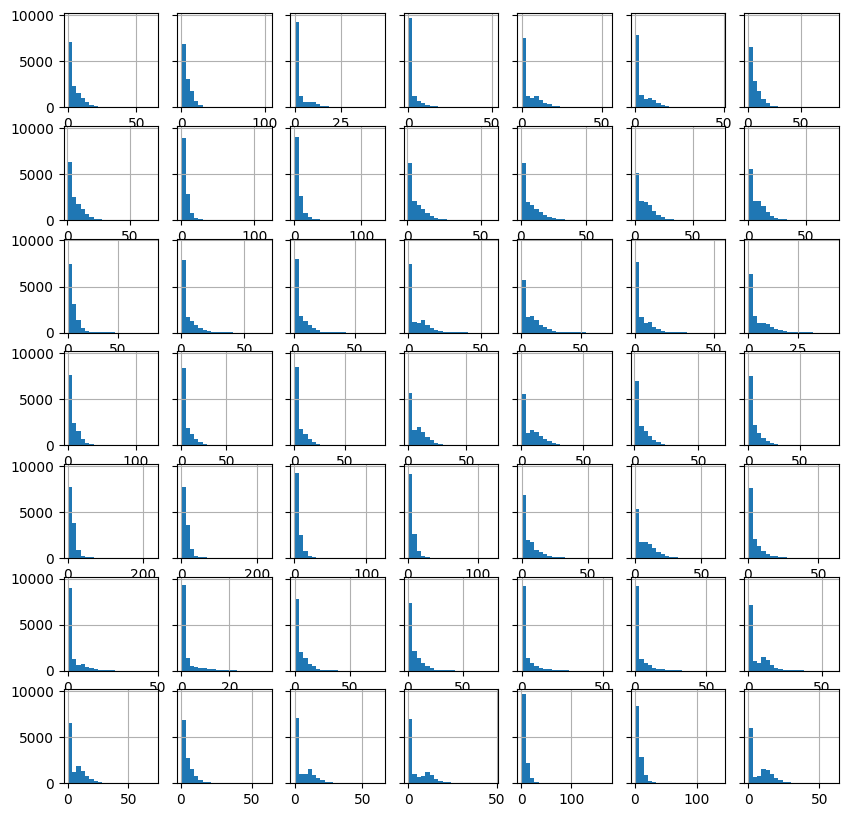
147
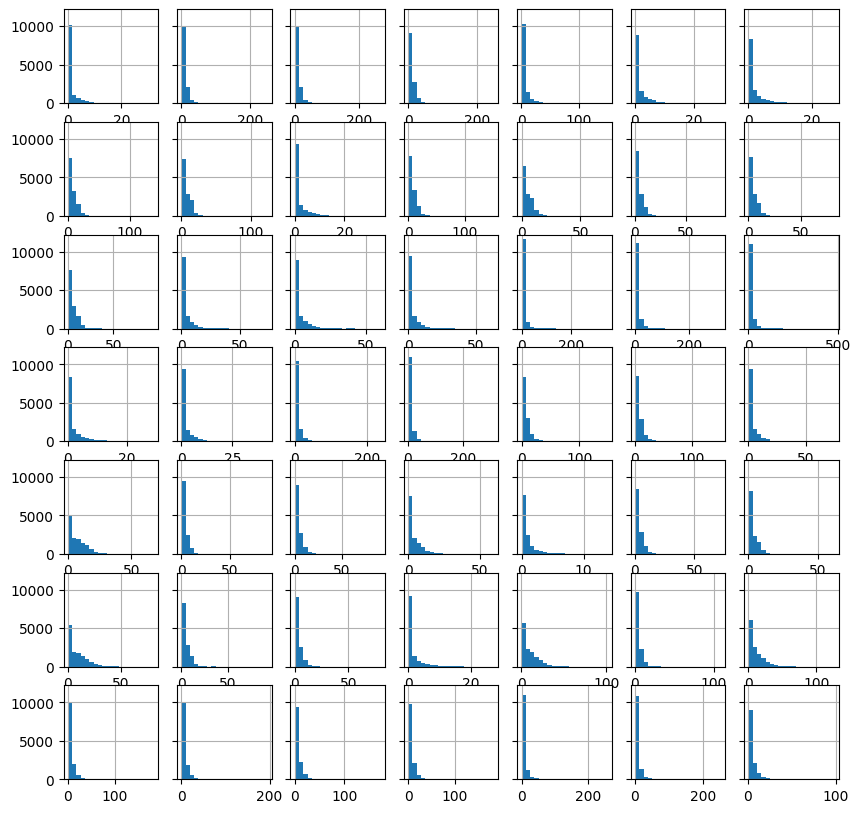
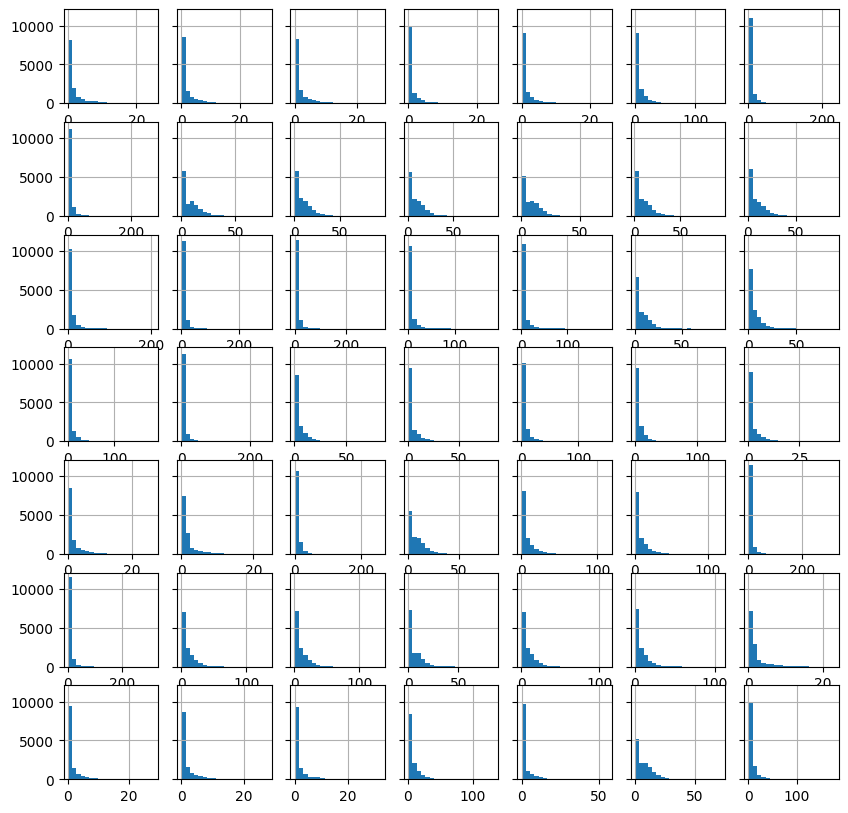
[14]:
st = 147

fig, axes = plt.subplots(7, 7, figsize=(10, 10), sharey="all")

idx = st
for _, ax in enumerate(axes.flat):

    hist(streamflow.iloc[:, idx].values.reshape(-1,),
         bins=20,
         ax=ax,
         show=False
        )

    idx += 1

plt.show()
print(idx)
196
[15]:
st = 196

fig, axes = plt.subplots(7, 7, figsize=(10, 10), sharey="all")

idx = st
for _, ax in enumerate(axes.flat):

    hist(streamflow.iloc[:, idx].values.reshape(-1,),
         bins=20,
         ax=ax,
         show=False
        )

    idx += 1

plt.show()
print(idx)
245
[16]:
st = 245

fig, axes = plt.subplots(7, 7, figsize=(10, 10), sharey="all")

idx = st
for _, ax in enumerate(axes.flat):

    hist(streamflow.iloc[:, idx].values.reshape(-1,),
         bins=20,
         ax=ax,
         show=False
        )

    idx += 1

plt.show()
print(idx)
294
[17]:
st = 294

fig, axes = plt.subplots(7, 7, figsize=(10, 10), sharey="all")

idx = st
for _, ax in enumerate(axes.flat):

    hist(streamflow.iloc[:, idx].values.reshape(-1,),
         bins=20,
         ax=ax,
         show=False
        )

    idx += 1

plt.show()
print(idx)
343
[18]:
st = 343

fig, axes = plt.subplots(7, 7, figsize=(10, 10), sharey="all")

idx = st
for _, ax in enumerate(axes.flat):

    hist(streamflow.iloc[:, idx].values.reshape(-1,),
         bins=20,
         ax=ax,
         show=False
        )

    idx += 1

plt.show()
print(idx)
392
[19]:
st = 392

fig, axes = plt.subplots(7, 7, figsize=(10, 10), sharey="all")

idx = st
for _, ax in enumerate(axes.flat):

    hist(streamflow.iloc[:, idx].values.reshape(-1,),
         bins=20,
         ax=ax,
         show=False
        )

    idx += 1

plt.show()
print(idx)
441
[20]:
st = 441

fig, axes = plt.subplots(7, 7, figsize=(10, 10), sharey="all")

idx = st
for _, ax in enumerate(axes.flat):

    hist(streamflow.iloc[:, idx].values.reshape(-1,),
         bins=20,
         ax=ax,
         show=False
        )

    idx += 1

plt.show()
print(idx)
490
[21]:
st = 490

fig, axes = plt.subplots(7, 7, figsize=(10, 10), sharey="all")

idx = st
for _, ax in enumerate(axes.flat):

    hist(streamflow.iloc[:, idx].values.reshape(-1,),
         bins=20,
         ax=ax,
         show=False
        )

    idx += 1

plt.show()
print(idx)
539
[22]:
st = 539

fig, axes = plt.subplots(7, 7, figsize=(10, 10), sharey="all")

idx = st
for _, ax in enumerate(axes.flat):

    if idx >= 564:
        break

    hist(streamflow.iloc[:, idx].values.reshape(-1,),
         bins=20,
         ax=ax,
         show=False
        )

    idx += 1

plt.show()
print(idx)
564
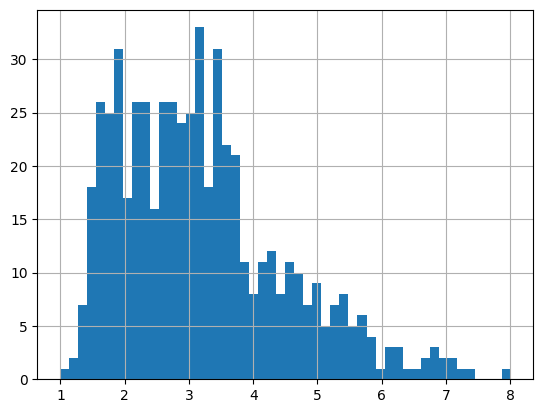
[23]:
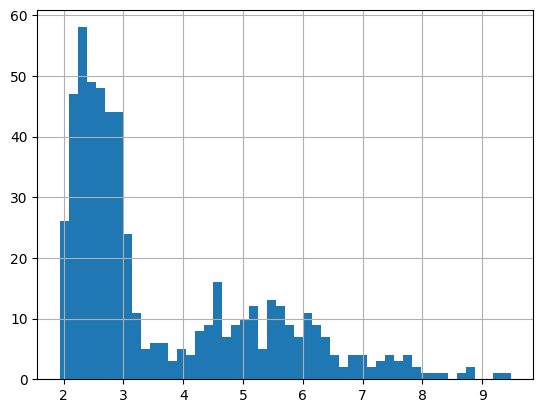
# skewness of streamflow

_ = hist(streamflow.skew().values.reshape(-1,), bins=50)
Potential evapotranspiration
[27]:
pet = dataset.fetch(dynamic_features = 'PET_mm', as_dataframe=True)
pet = pet.reset_index()
pet.index = pd.to_datetime(pet.pop('time'))
pet.pop('dynamic_features')
print(pet.shape)
EDA(data=pet, save=False).heatmap()
(12783, 564)

[27]:
<Axes: ylabel='Examples'>
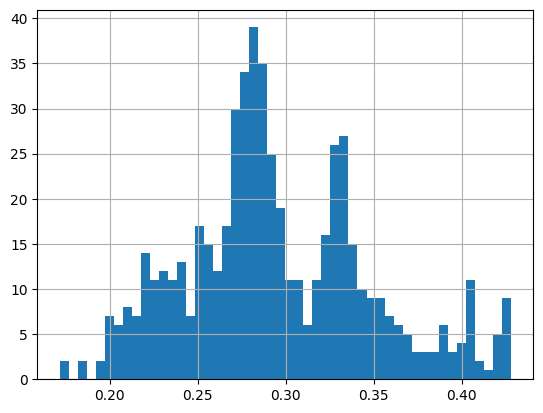
[28]:
_ = hist(pet.skew().values.reshape(-1,), bins=50)
Soil Temperature
[31]:
sm = dataset.fetch(dynamic_features = 'SM_mm', as_dataframe=True)
sm = sm.reset_index()
sm.index = pd.to_datetime(sm.pop('time'))
sm.pop('dynamic_features')
print(sm.shape)

EDA(data=sm, save=False).heatmap()
(12783, 564)

[31]:
<Axes: ylabel='Examples'>
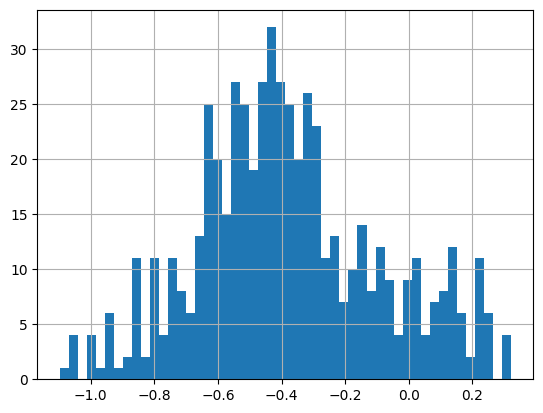
[32]:
_ = hist(sm.skew().values.reshape(-1,), bins=50)
Precipitation
[29]:
pcp = dataset.fetch(dynamic_features = 'Prec_mm', as_dataframe=True)
pcp = pcp.reset_index()
pcp.index = pd.to_datetime(pcp.pop('time'))
pcp.pop('dynamic_features')
print(pcp.shape)
EDA(data=pcp, save=False).heatmap()
(12783, 564)

[29]:
<Axes: ylabel='Examples'>
[30]:
_ = hist(pcp.skew().values.reshape(-1,), bins=50)
[69]: