[1]:
%matplotlib inline
![]()
![]()
beach water quality
[2]:
from ai4water.eda import EDA
from ai4water.datasets import busan_beach
from ai4water.utils.utils import get_version_info

for lib, ver in get_version_info().items():
    print(f"{lib} {ver}")
**********Tensorflow models could not be imported **********

python 3.8.12 | packaged by conda-forge | (default, Oct 12 2021, 21:19:05) [MSC v.1916 64 bit (AMD64)]
os nt
ai4water 1.06
easy_mpl 0.21.3
SeqMetrics 1.3.3
numpy 1.22.2
pandas 1.4.0
matplotlib 3.5.1
h5py 3.6.0
joblib 1.2.0
sklearn 1.2.1
xarray 0.21.1
netCDF4 1.5.8
seaborn 0.12.0
D:\C\Anaconda3\envs\ai4w_dataset\lib\site-packages\sklearn\experimental\enable_hist_gradient_boosting.py:16: UserWarning: Since version 1.0, it is not needed to import enable_hist_gradient_boosting anymore. HistGradientBoostingClassifier and HistGradientBoostingRegressor are now stable and can be normally imported from sklearn.ensemble.
  warnings.warn(
[3]:
(1446, 18)
[4]:
data.head()
[4]:
| tide_cm | wat_temp_c | sal_psu | air_temp_c | pcp_mm | pcp3_mm | pcp6_mm | pcp12_mm | wind_dir_deg | wind_speed_mps | air_p_hpa | mslp_hpa | rel_hum | ecoli | sul1_coppml | aac_coppml | tetx_coppml | blaTEM_coppml | |
|---|---|---|---|---|---|---|---|---|---|---|---|---|---|---|---|---|---|---|
| index | ||||||||||||||||||
| 2018-06-19 00:00:00 | 36.407149 | 19.321232 | 33.956058 | 19.780000 | 0.0 | 0.0 | 0.0 | 0.0 | 159.533333 | 0.960000 | 1002.856667 | 1007.256667 | 95.000000 | NaN | NaN | NaN | NaN | NaN |
| 2018-06-19 00:30:00 | 35.562515 | 19.320124 | 33.950508 | 19.093333 | 0.0 | 0.0 | 0.0 | 0.0 | 86.596667 | 0.163333 | 1002.300000 | 1006.700000 | 95.000000 | NaN | NaN | NaN | NaN | NaN |
| 2018-06-19 01:00:00 | 34.808016 | 19.319666 | 33.942532 | 18.733333 | 0.0 | 0.0 | 0.0 | 0.0 | 2.260000 | 0.080000 | 1001.973333 | 1006.373333 | 95.000000 | NaN | NaN | NaN | NaN | NaN |
| 2018-06-19 01:30:00 | 30.645216 | 19.320406 | 33.931263 | 18.760000 | 0.0 | 0.0 | 0.0 | 0.0 | 62.710000 | 0.193333 | 1001.776667 | 1006.120000 | 95.006667 | NaN | NaN | NaN | NaN | NaN |
| 2018-06-19 02:00:00 | 26.608980 | 19.326729 | 33.917961 | 18.633333 | 0.0 | 0.0 | 0.0 | 0.0 | 63.446667 | 0.510000 | 1001.743333 | 1006.103333 | 95.006667 | NaN | NaN | NaN | NaN | NaN |
[5]:
data.isna().sum()
[5]:
tide_cm              0
wat_temp_c           0
sal_psu              0
air_temp_c           0
pcp_mm               0
pcp3_mm              0
pcp6_mm              0
pcp12_mm             0
wind_dir_deg         0
wind_speed_mps       0
air_p_hpa            0
mslp_hpa             0
rel_hum              0
ecoli             1279
sul1_coppml       1228
aac_coppml        1228
tetx_coppml       1228
blaTEM_coppml     1228
dtype: int64
[6]:
data.isna().sum()
[6]:
tide_cm              0
wat_temp_c           0
sal_psu              0
air_temp_c           0
pcp_mm               0
pcp3_mm              0
pcp6_mm              0
pcp12_mm             0
wind_dir_deg         0
wind_speed_mps       0
air_p_hpa            0
mslp_hpa             0
rel_hum              0
ecoli             1279
sul1_coppml       1228
aac_coppml        1228
tetx_coppml       1228
blaTEM_coppml     1228
dtype: int64
[7]:
eda = EDA(data, save=False)
[8]:
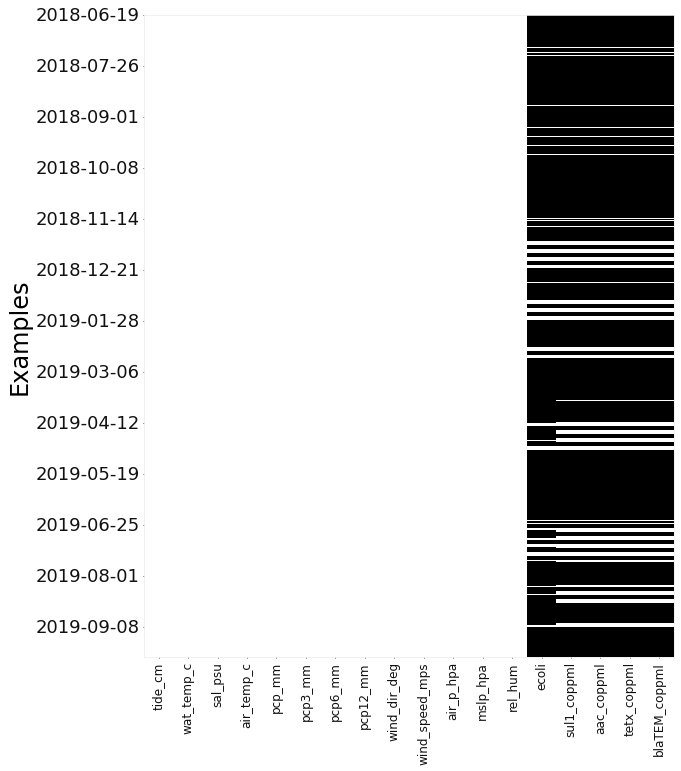
eda.heatmap()
[8]:
<AxesSubplot:ylabel='Examples'>
[9]:
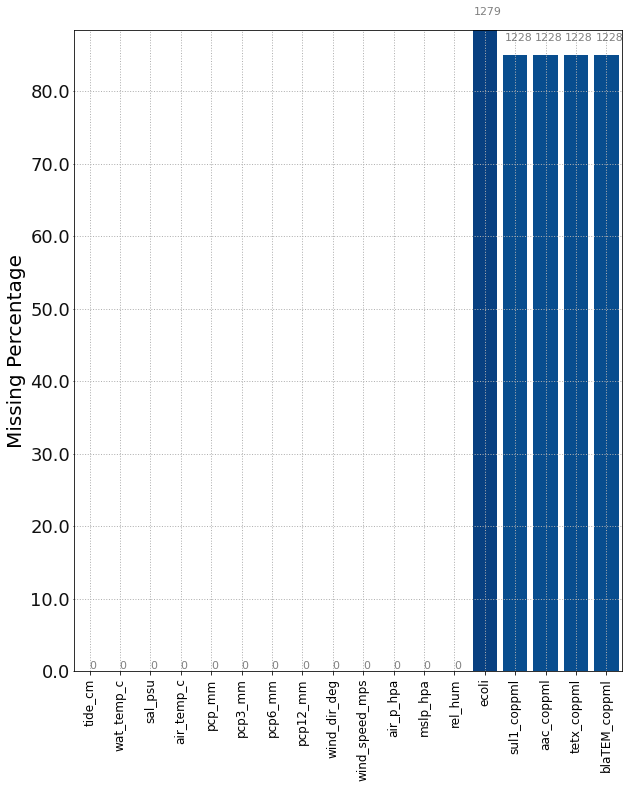
_ = eda.plot_missing()
D:\C\Anaconda3\envs\ai4w_dataset\lib\site-packages\ai4water\eda\_main.py:377: UserWarning: FixedFormatter should only be used together with FixedLocator
  ax1.set_yticklabels(ax1.get_yticks(), fontsize="18")
[10]:
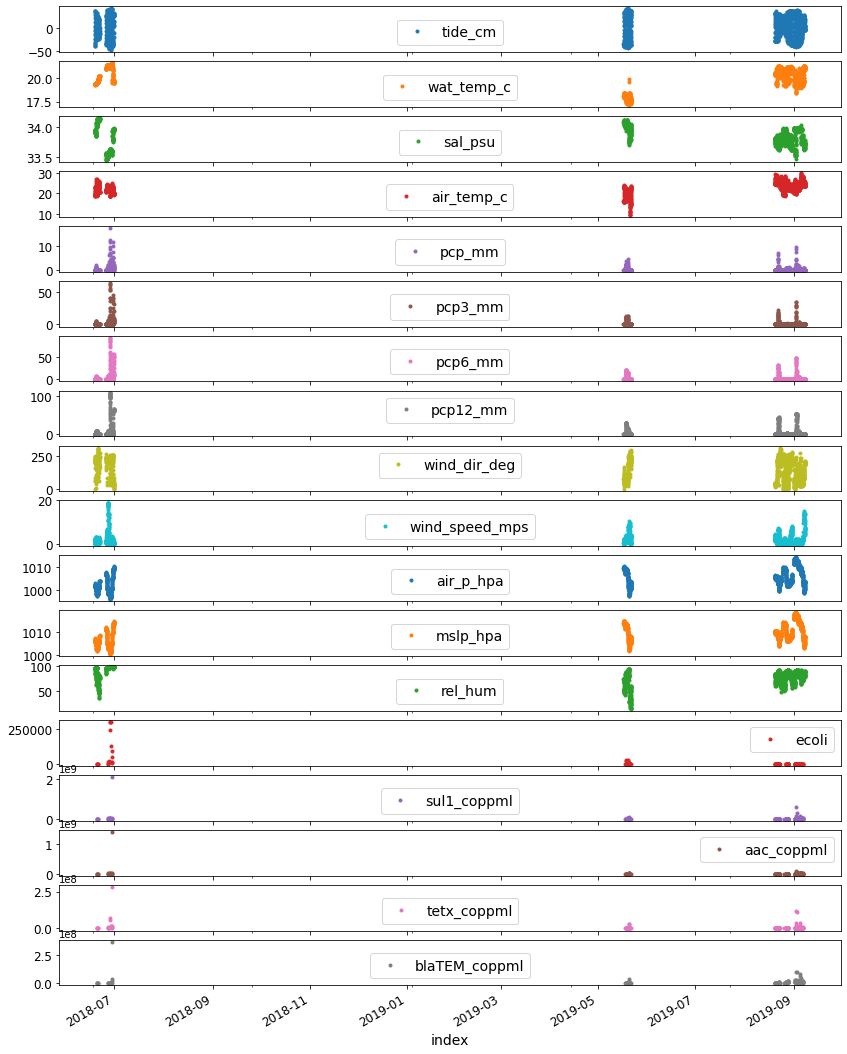
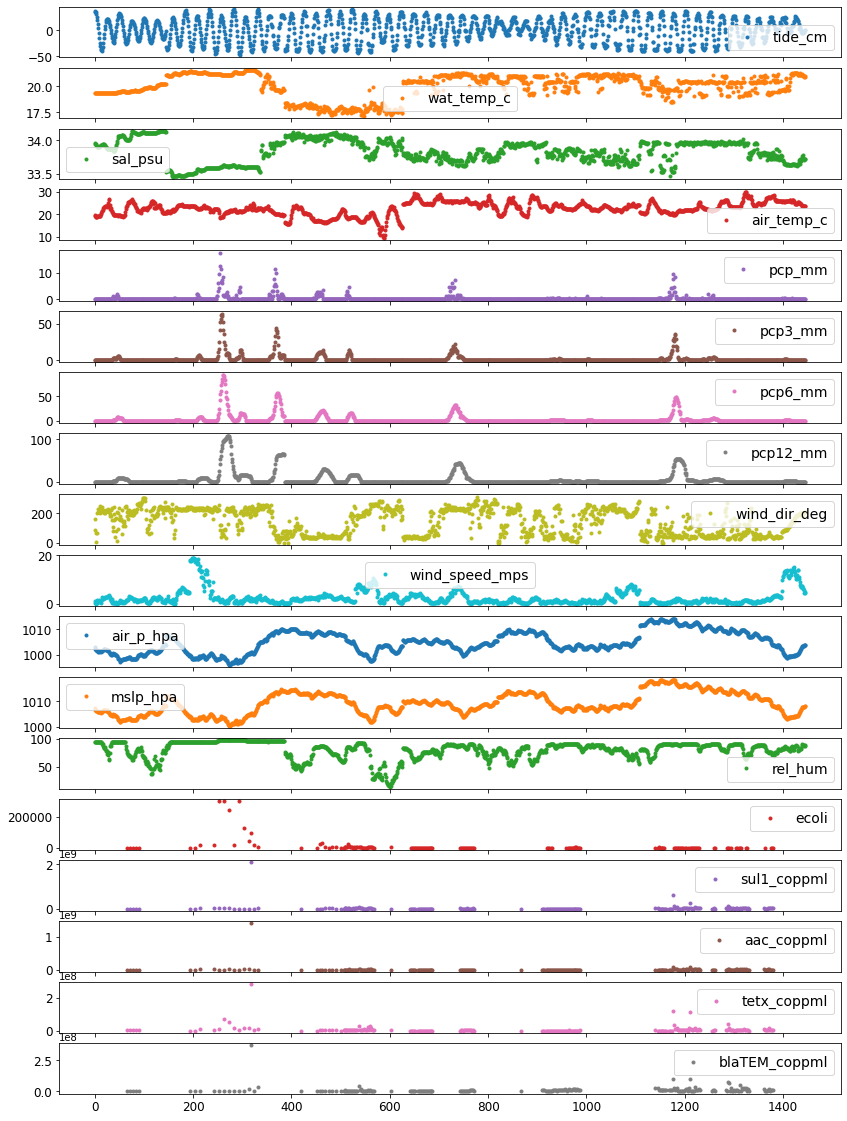
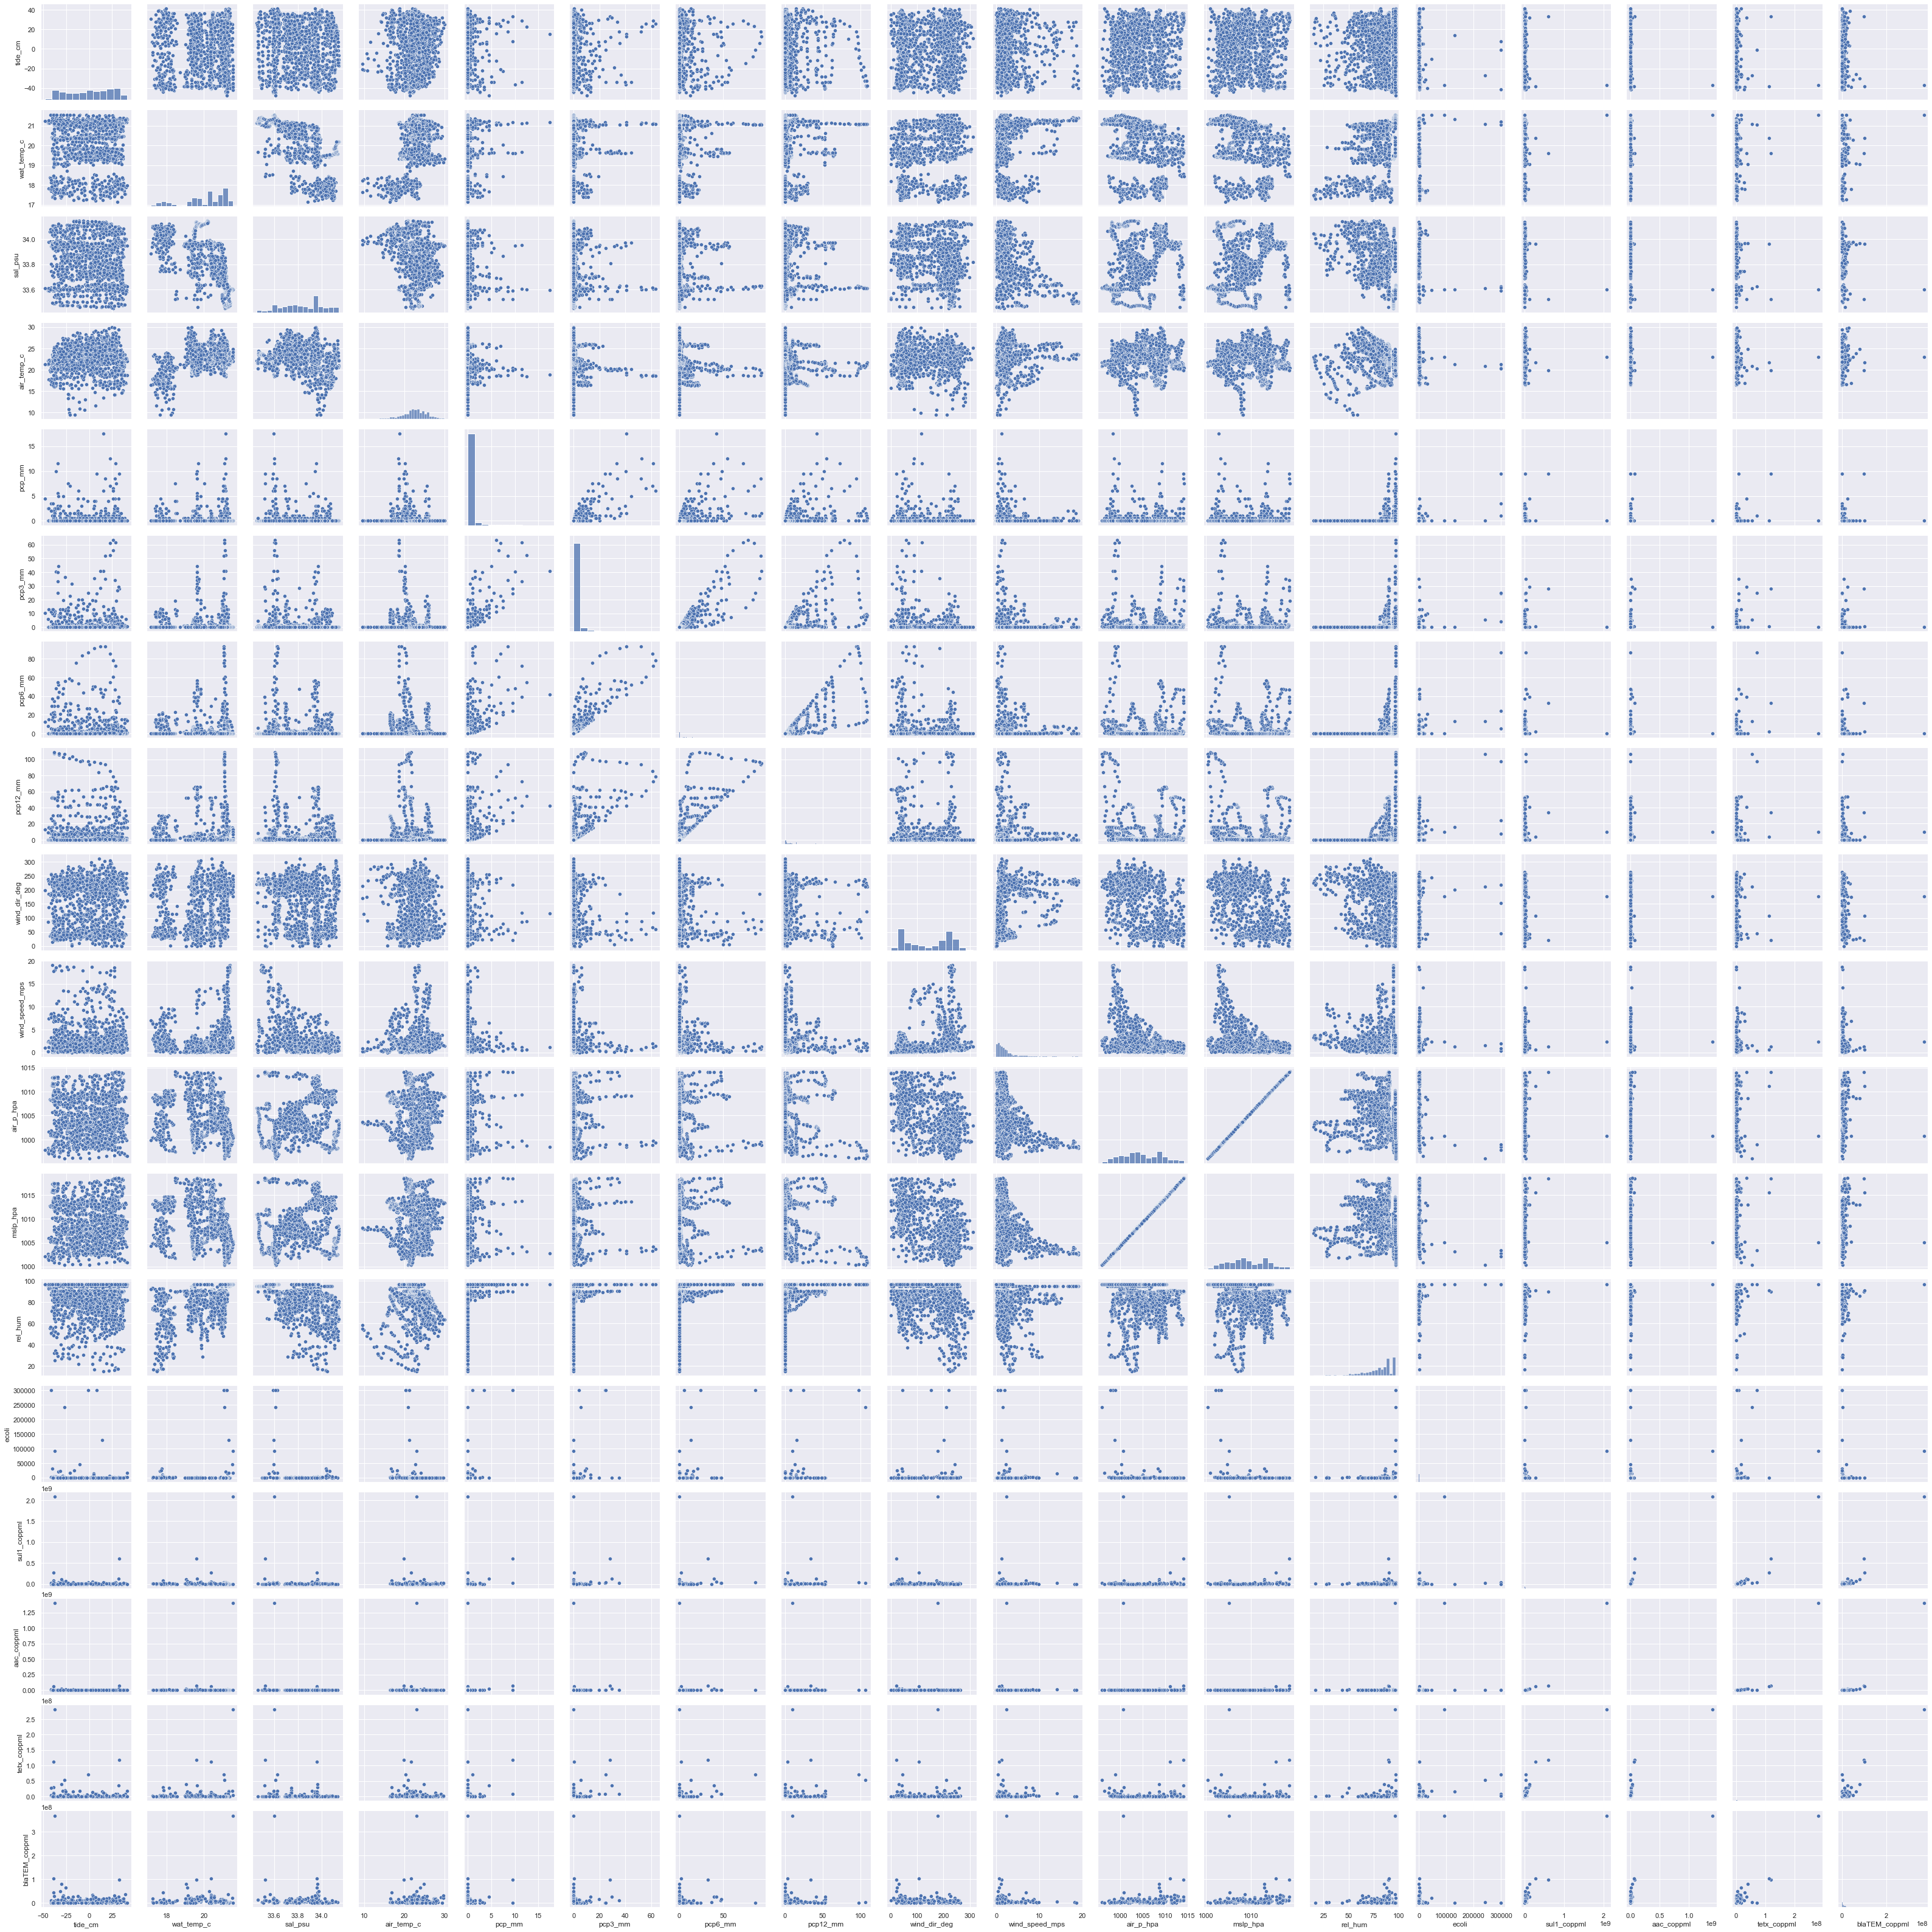
_ = eda.plot_data(subplots=True, max_cols_in_plot=20, figsize=(14, 20))
[11]:
eda.plot_data(subplots=True, max_cols_in_plot=20, figsize=(14, 20),
              ignore_datetime_index=True)
[12]:
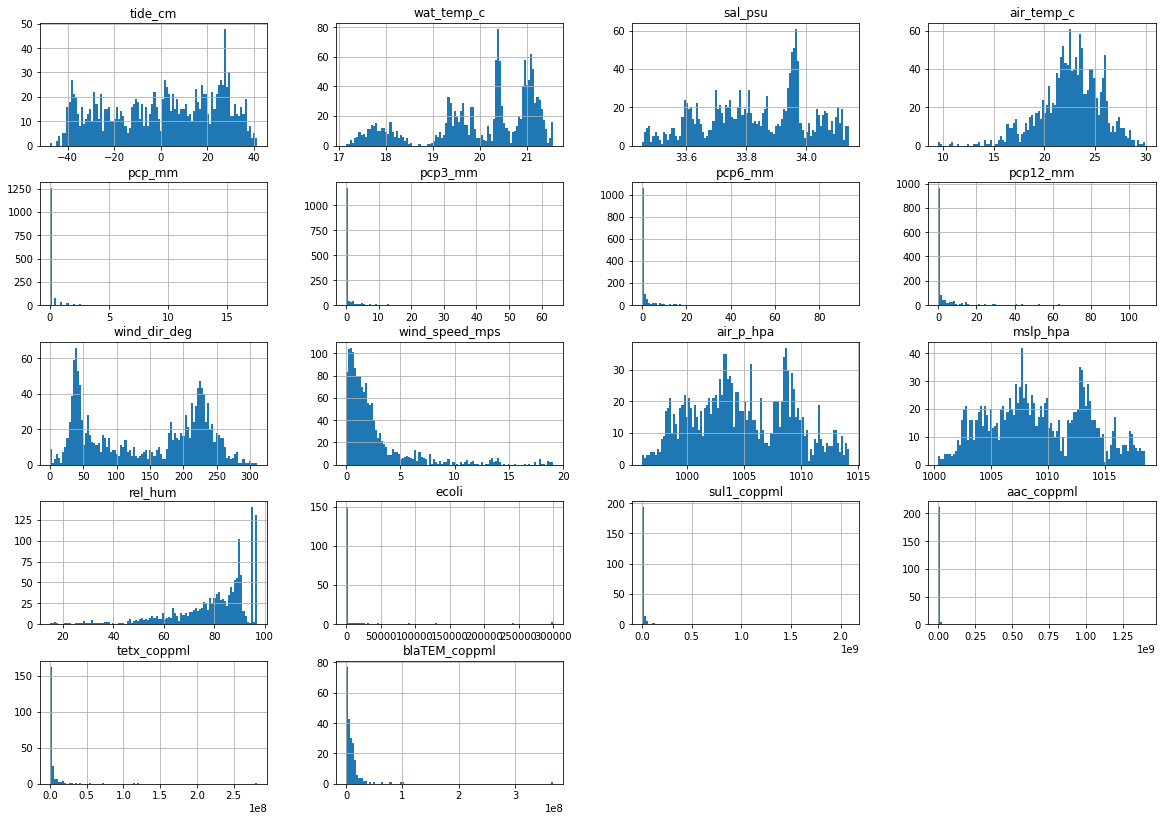
_ = eda.plot_histograms()
[13]:
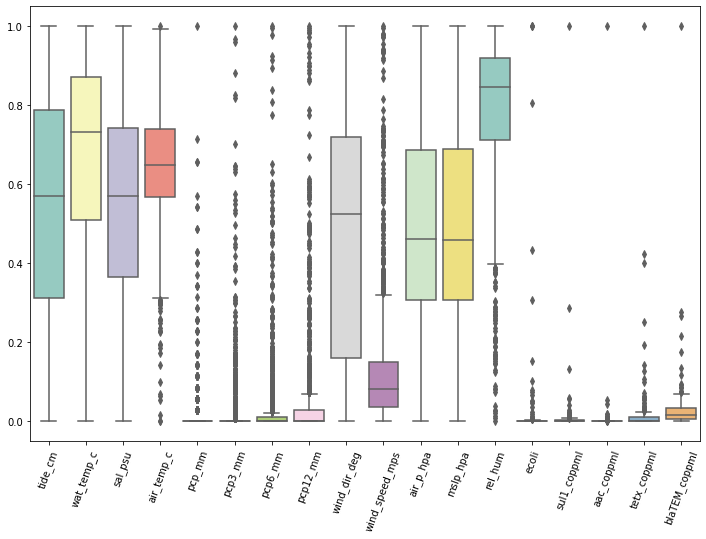
_ = eda.box_plot(max_features=18, palette="Set3")
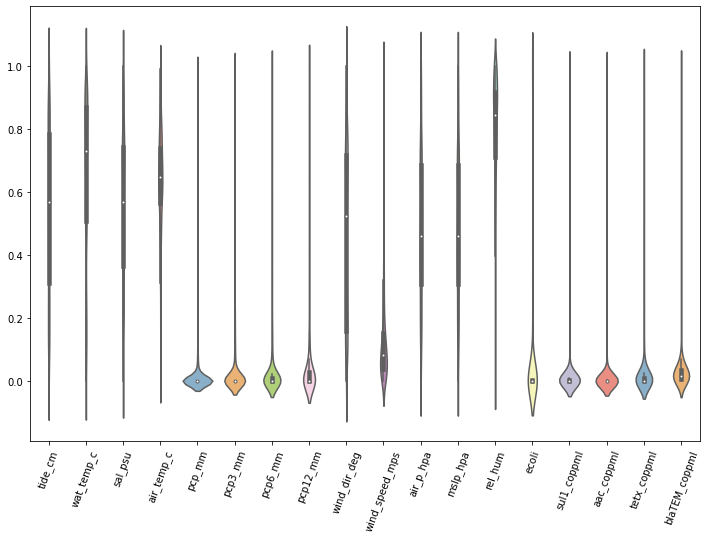
[14]:
_ = eda.box_plot(max_features=18, palette="Set3", violen=True)
[15]:
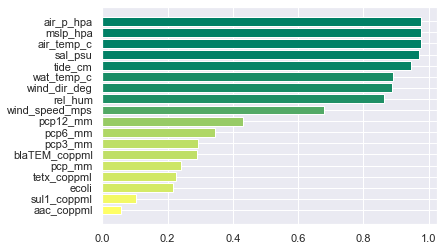
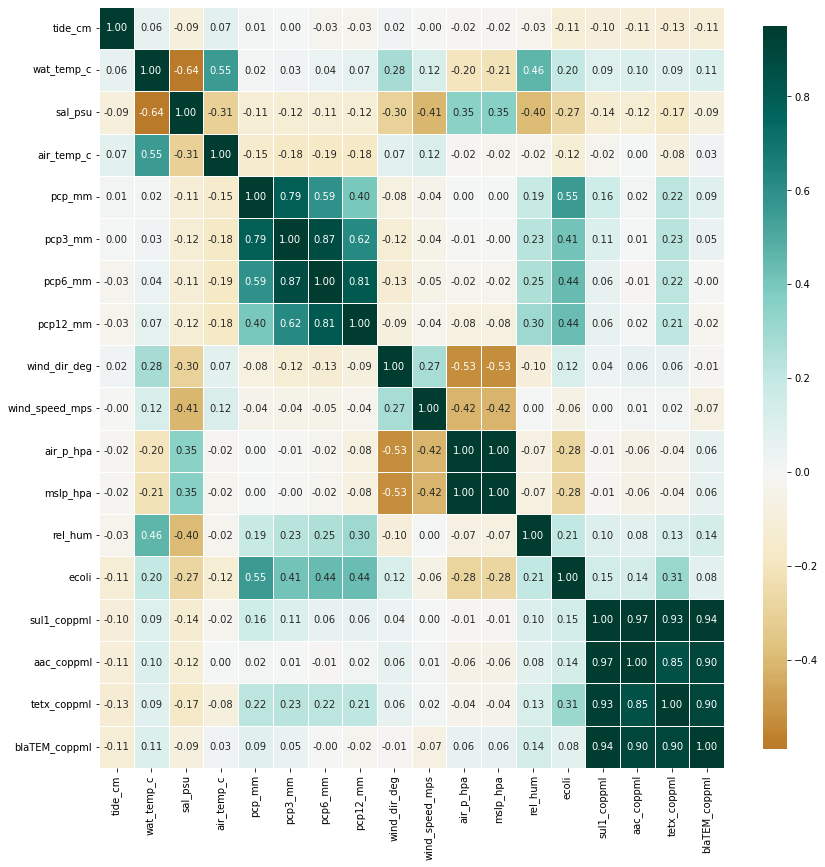
_ = eda.correlation(figsize=(14, 14))
[16]:
_ = eda.grouped_scatter(max_subplots=18)
D:\C\Anaconda3\envs\ai4w_dataset\lib\site-packages\seaborn\axisgrid.py:2095: UserWarning: The `size` parameter has been renamed to `height`; please update your code.
  warnings.warn(msg, UserWarning)
[17]:
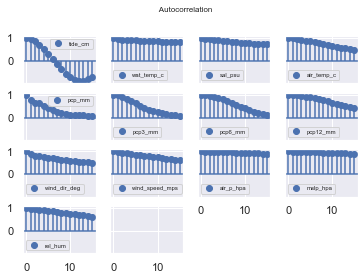
_ = eda.autocorrelation(n_lags=15)
cannot plot autocorrelation for ecoli feature
cannot plot autocorrelation for sul1_coppml feature
cannot plot autocorrelation for aac_coppml feature
[18]:
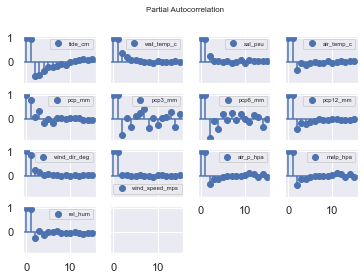
_ = eda.partial_autocorrelation(n_lags=15)
cannot plot autocorrelation for ecoli feature
cannot plot autocorrelation for sul1_coppml feature
cannot plot autocorrelation for aac_coppml feature
[19]:
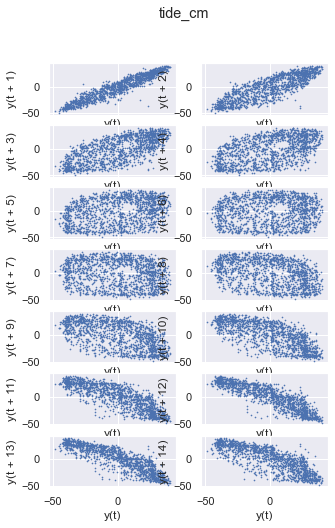
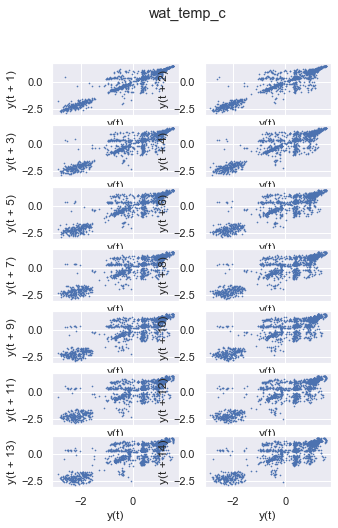
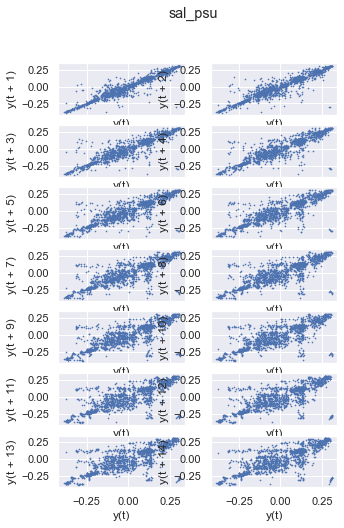
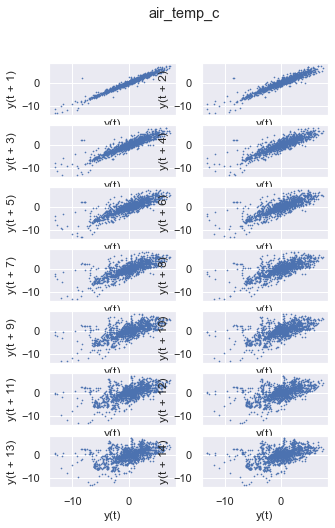
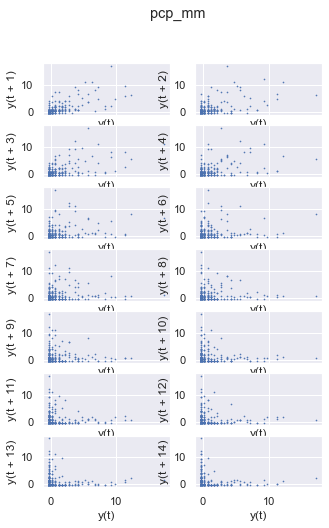
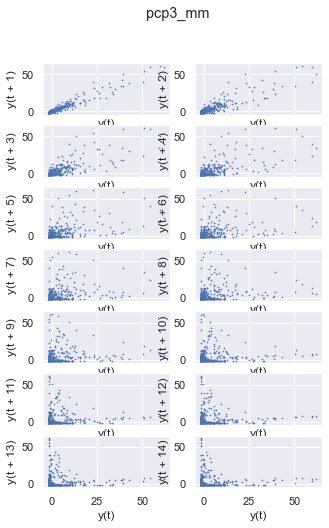
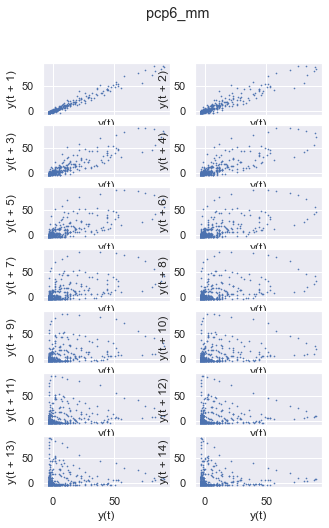
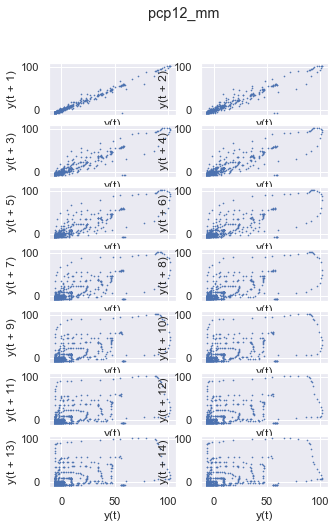
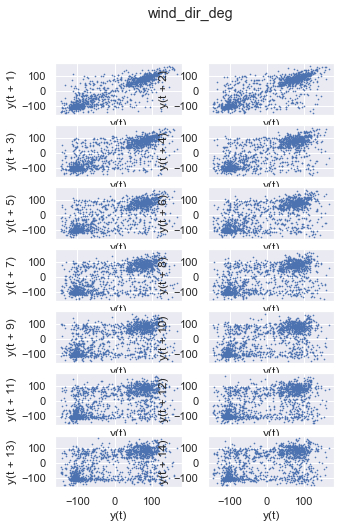
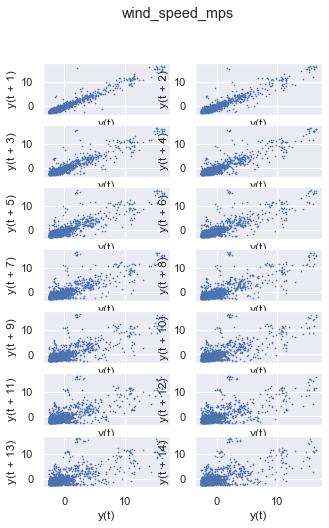
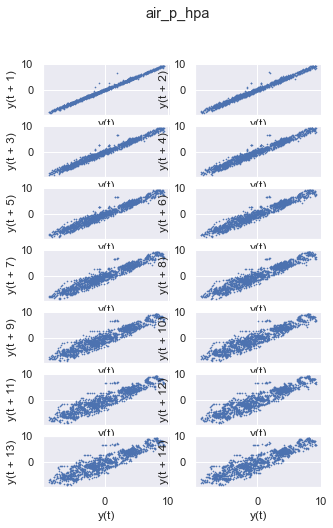
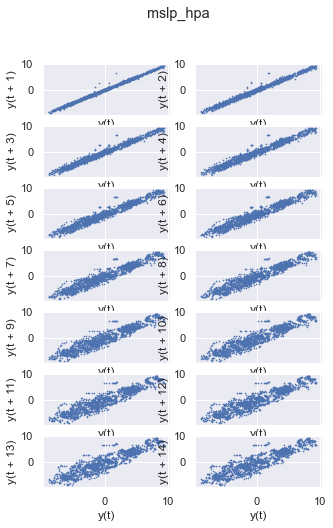
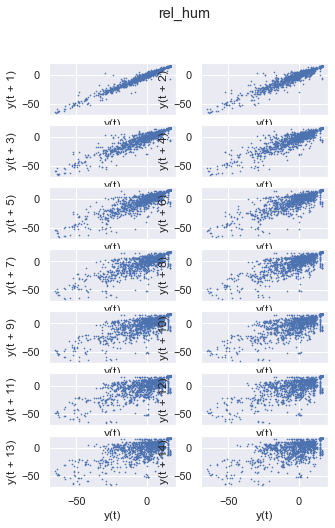
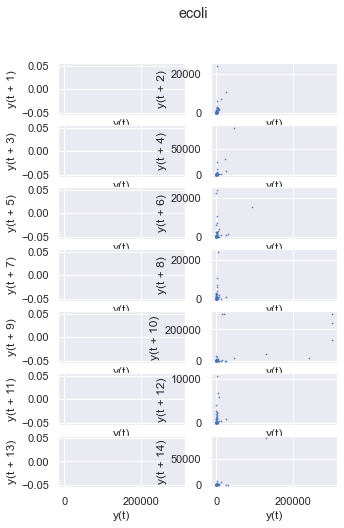
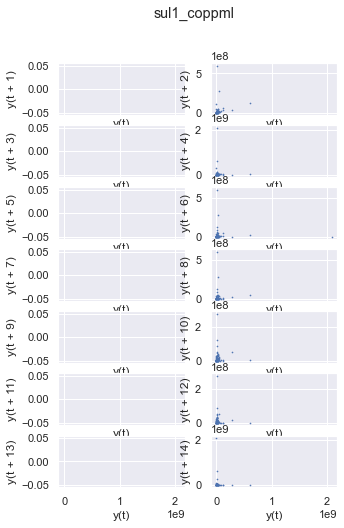
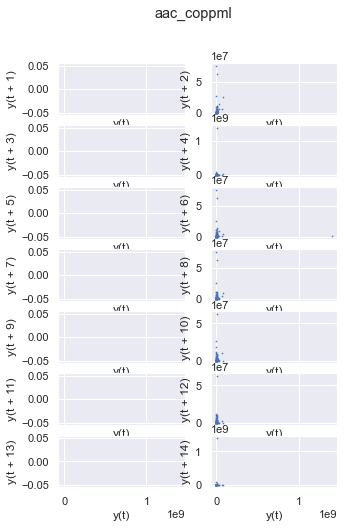
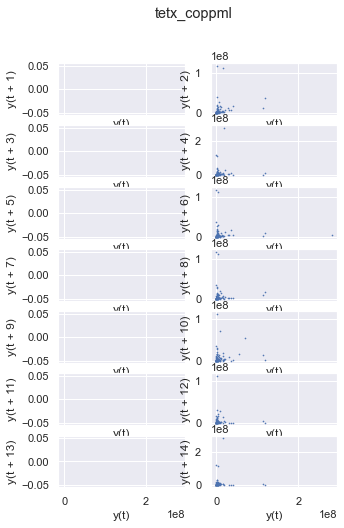
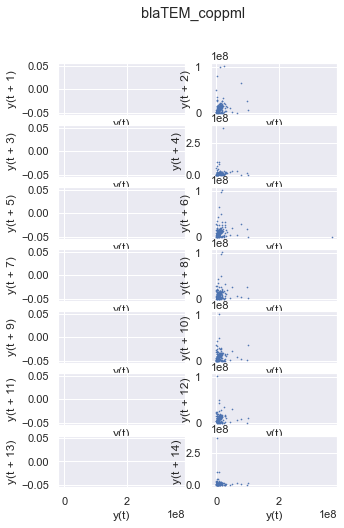
_ = eda.lag_plot(n_lags=14, s=0.4)
[20]:
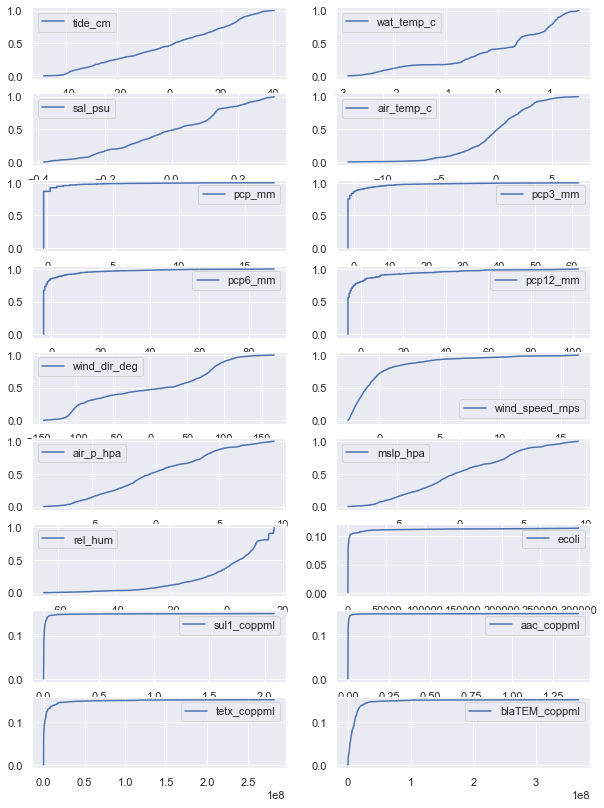
_ = eda.plot_ecdf(figsize=(10, 14))
[21]:
eda.normality_test()