[1]:
%matplotlib inline
![]()
![]()
Rainfall-runoff dataset of Laos
[1]:
import site
site.addsitedir("D:\\mytools\\AI4Water")
[ ]:
try:
    import ai4water
except ModuleNotFoundError:
    !pip install git+https://github.com/AtrCheema/AI4Water.git@197383e875cae63b3afbdbbce21f6c00db6ada44
[29]:
import matplotlib.pyplot as plt

from easy_mpl import boxplot, hist
from easy_mpl import pie, plot

from ai4water.eda import EDA
from ai4water.eda import EDA
from ai4water.datasets import MtropicsLaos, ecoli_mekong
from ai4water.utils.utils import get_version_info
[3]:
for lib, ver in get_version_info().items():
    print(lib, ver)
python 3.9.7 | packaged by conda-forge | (default, Sep 29 2021, 19:20:16) [MSC v.1916 64 bit (AMD64)]
os nt
ai4water 1.06
lightgbm 3.3.1
tcn 3.4.0
catboost 0.26
xgboost 1.5.0
easy_mpl 0.21.3
SeqMetrics 1.3.3
tensorflow 2.7.0
keras.api._v2.keras 2.7.0
numpy 1.21.0
pandas 1.3.4
matplotlib 3.4.3
h5py 3.5.0
sklearn 1.0.1
shapefile 2.3.0
fiona 1.8.22
xarray 0.20.1
netCDF4 1.5.7
optuna 2.10.1
skopt 0.9.0
hyperopt 0.2.7
plotly 5.3.1
lime NotDefined
seaborn 0.11.2
[4]:
laos = MtropicsLaos(
    path="F:\\data\\MtropicsLaos"
)
    Not downloading the data since the directory
    F:\data\MtropicsLaos already exists.
    Use overwrite=True to remove previously saved files and download again
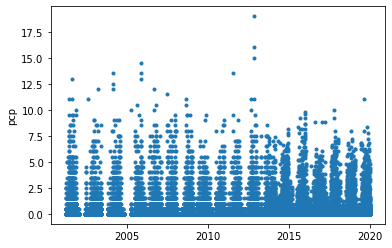
precipitation
(1665359, 1)
[32]:
pcp.head()
[32]:
| pcp | |
|---|---|
| 2001-01-01 00:06:00 | NaN |
| 2001-01-01 00:12:00 | NaN |
| 2001-01-01 00:18:00 | NaN |
| 2001-01-01 00:24:00 | NaN |
| 2001-01-01 00:30:00 | NaN |
[33]:
pcp.tail()
[33]:
| pcp | |
|---|---|
| 2019-12-31 23:30:00 | 0.0 |
| 2019-12-31 23:36:00 | 0.0 |
| 2019-12-31 23:42:00 | 0.0 |
| 2019-12-31 23:48:00 | 0.0 |
| 2019-12-31 23:54:00 | 0.0 |
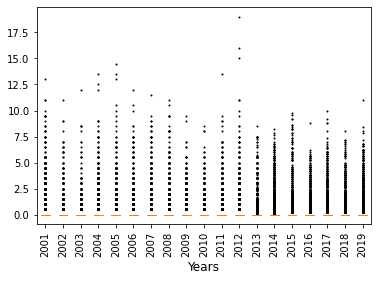
[34]:
groupby_year = pcp.groupby(lambda x: x.year)
[45]:
2001 19764
2002 35978
2003 35732
2004 16633
2005 19608
2006 1
2007 1015
2008 2880
2009 2177
2010 9039
2011 10676
2012 16133
2013 5627
2014 775
2015 1127
2016 960
2017 2766
2018 1174
2019 1278
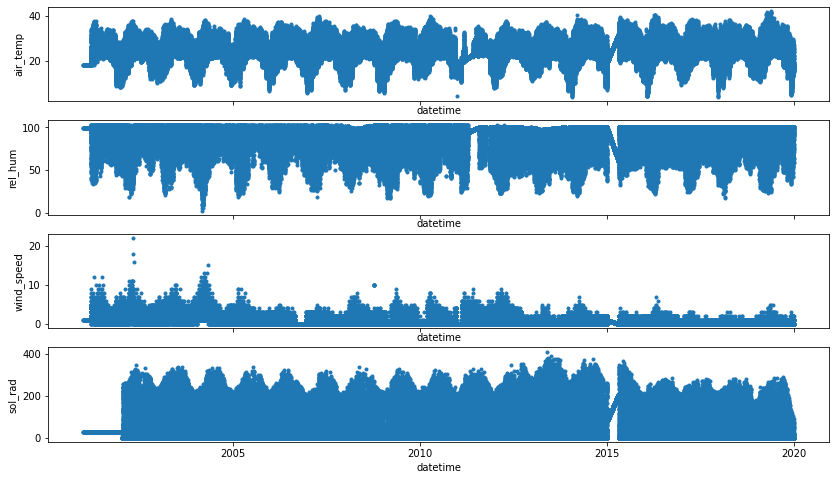
weather station
(166536, 4)
[49]:
w.isna().sum()
[49]:
air_temp      0
rel_hum       0
wind_speed    0
sol_rad       0
dtype: int64
[50]:
w.head()
[50]:
| air_temp | rel_hum | wind_speed | sol_rad | |
|---|---|---|---|---|
| datetime | ||||
| 2001-01-01 01:00:00 | 18.3 | 99.5 | 1.0 | 28.0 |
| 2001-01-01 02:00:00 | 18.3 | 99.5 | 1.0 | 28.0 |
| 2001-01-01 03:00:00 | 18.3 | 99.5 | 1.0 | 28.0 |
| 2001-01-01 04:00:00 | 18.3 | 99.5 | 1.0 | 28.0 |
| 2001-01-01 05:00:00 | 18.3 | 99.5 | 1.0 | 28.0 |
[51]:
w.tail()
[51]:
| air_temp | rel_hum | wind_speed | sol_rad | |
|---|---|---|---|---|
| datetime | ||||
| 2019-12-31 20:00:00 | 18.3 | 91.5 | 0.0 | 0.0 |
| 2019-12-31 21:00:00 | 18.3 | 90.8 | 0.0 | 0.0 |
| 2019-12-31 22:00:00 | 17.7 | 93.6 | 0.0 | 0.0 |
| 2019-12-31 23:00:00 | 17.3 | 95.1 | 0.0 | 0.0 |
| 2020-01-01 00:00:00 | 16.3 | 99.1 | 0.0 | 0.0 |
[60]:
f, axes = plt.subplots(4, figsize=(14, 8), sharex="all")

for idx, ax in enumerate(axes.flatten()):

    _ = plot(w.iloc[:, idx], '.', ax=ax, show=False)

plt.show()
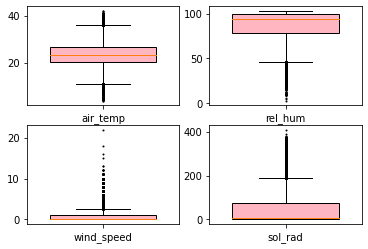
[65]:
_ = boxplot(w, share_axes=False, flierprops={"ms": 1.0},
           widths=0.7,
            fill_color="lightpink", patch_artist=True,
           )
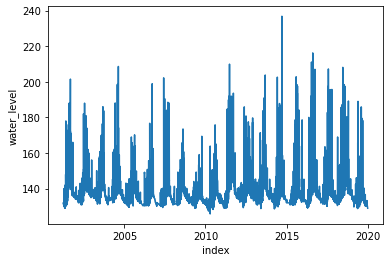
Water Level and Suspended matter
[66]:
wl, spm = laos.fetch_hydro()
print(wl.shape)
(454694, 1)
Value based partial slicing on non-monotonic DatetimeIndexes with non-existing keys is deprecated and will raise a KeyError in a future Version.
[70]:
_ = plot(wl)
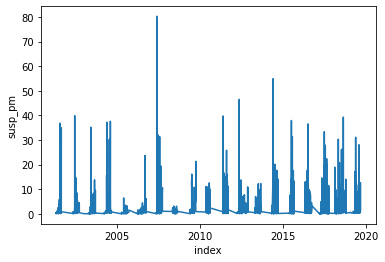
[71]:
print(spm.shape)
(6428, 1)
[73]:
_ = plot(spm)
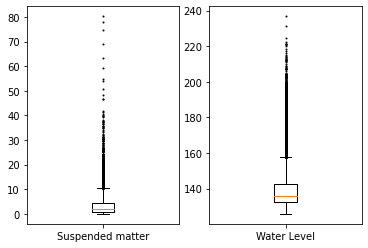
[76]:
_ = boxplot(
    [spm.values.reshape(-1,), wl.values.reshape(-1,)],
    labels=["Suspended matter", "Water Level"],
    share_axes=False,
    flierprops={"ms": 1.0},
)
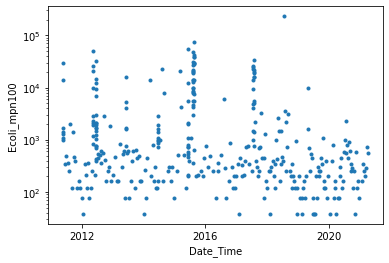
Ecoli
(409, 1)
[80]:
print(ecoli.head())
                     Ecoli_mpn100
Date_Time
2011-05-25 10:00:00           NaN
2011-05-25 16:40:00        1100.0
2011-05-25 17:06:00        1400.0
2011-05-25 17:10:00           NaN
2011-05-25 17:24:00       14000.0
[81]:
print(ecoli.tail())
                     Ecoli_mpn100
Date_Time
2021-02-25 14:10:00         250.0
2021-03-07 14:10:00         200.0
2021-03-17 15:11:00         290.0
2021-03-27 15:22:00         720.0
2021-04-06 15:05:00         560.0
(409, 3)
[84]:
ecoli_all.isna().sum()
[84]:
Ecoli_LL_mpn100    60
Ecoli_mpn100       42
Ecoli_UL_mpn100    60
dtype: int64
[11]:
ecoli_all.head()
[11]:
| Ecoli_LL_mpn100 | Ecoli_mpn100 | Ecoli_UL_mpn100 | |
|---|---|---|---|
| Date_Time | |||
| 2011-05-25 10:00:00 | NaN | NaN | NaN |
| 2011-05-25 16:40:00 | 715.0 | 1100.0 | 1550.0 |
| 2011-05-25 17:06:00 | 1000.0 | 1400.0 | 1900.0 |
| 2011-05-25 17:10:00 | NaN | NaN | NaN |
| 2011-05-25 17:24:00 | 9000.0 | 14000.0 | 22000.0 |
(411, 1)
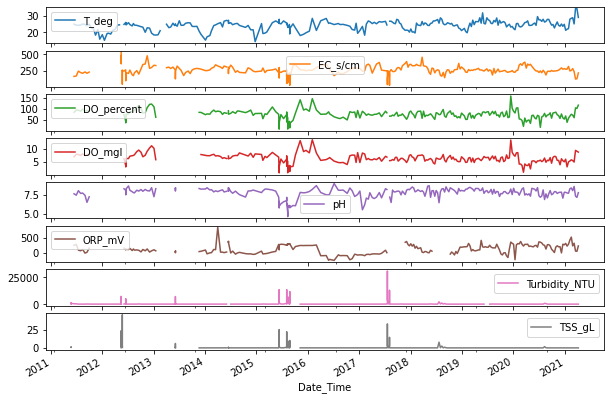
pysiochemical attributes
[85]:
phy_chem_all = laos.fetch_physiochem(features='all')
print(phy_chem_all.shape)
(411, 8)
[86]:
phy_chem_all.isna().sum()
[86]:
T_deg             63
EC_s/cm           27
DO_percent       101
DO_mgl           102
pH                94
ORP_mV           117
Turbidity_NTU     44
TSS_gL            92
dtype: int64
[94]:
_ = phy_chem_all.plot(
    subplots=True,
    figsize=(10, 7)
)
[95]:
phy_chem_all.head()
[95]:
| T_deg | EC_s/cm | DO_percent | DO_mgl | pH | ORP_mV | Turbidity_NTU | TSS_gL | |
|---|---|---|---|---|---|---|---|---|
| Date_Time | ||||||||
| 2011-05-25 10:00:00 | 24.11 | 273.0 | 87.5 | 7.34 | 7.67 | 53.5 | 13.5 | NaN |
| 2011-05-25 16:40:00 | NaN | NaN | NaN | NaN | NaN | NaN | 1380.0 | 0.8993 |
| 2011-05-25 17:06:00 | NaN | NaN | NaN | NaN | NaN | NaN | 1116.0 | 0.9932 |
| 2011-05-25 17:10:00 | NaN | NaN | NaN | NaN | NaN | NaN | 1392.0 | 1.1079 |
| 2011-05-25 17:24:00 | NaN | NaN | NaN | NaN | NaN | NaN | 702.0 | 1.3250 |
[96]:
phy_chem_all.tail()
[96]:
| T_deg | EC_s/cm | DO_percent | DO_mgl | pH | ORP_mV | Turbidity_NTU | TSS_gL | |
|---|---|---|---|---|---|---|---|---|
| Date_Time | ||||||||
| 2021-02-25 14:10:00 | 28.86 | 287.0 | 72.2 | 5.55 | 8.05 | 232.3 | 11.54 | 0.011 |
| 2021-03-07 14:10:00 | 25.08 | 242.0 | 60.6 | 4.97 | 8.60 | 318.7 | 15.95 | 0.005 |
| 2021-03-17 15:11:00 | 34.45 | 130.0 | 104.8 | 9.48 | 7.33 | 61.3 | 7.29 | 0.001 |
| 2021-03-27 15:22:00 | 34.43 | 135.0 | 102.2 | 9.15 | 7.17 | 55.6 | 7.55 | 0.003 |
| 2021-04-06 15:05:00 | 29.01 | 222.0 | 117.0 | 8.81 | 7.79 | 229.5 | 8.52 | 0.018 |
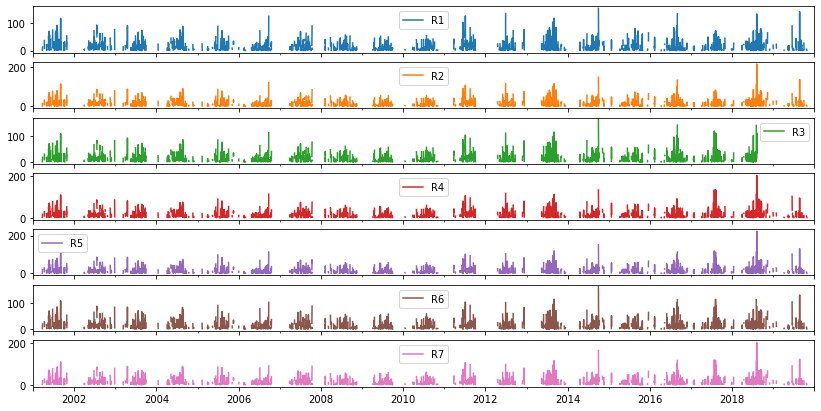
rain gauages
(6939, 7)
[101]:
_ = rg.plot(
    subplots=True,
    sharex=True,
    figsize=(14, 7)
)
regression
D:\C\Anaconda3\envs\ai4w_dataset\lib\site-packages\ai4water\datasets\mtropics.py:576: FutureWarning: Value based partial slicing on non-monotonic DatetimeIndexes with non-existing keys is deprecated and will raise a KeyError in a future Version.
  return wl.loc[st:en], spm.loc[st:en]
(650741, 9)
[16]:
df.head()
[16]:
| air_temp | rel_hum | wind_speed | sol_rad | water_level | pcp | susp_pm | Ecoli_source | Ecoli_mpn100 | |
|---|---|---|---|---|---|---|---|---|---|
| 2011-05-25 14:00:00 | 22.536906 | 96.167816 | 7.0 | 256.0 | 133.0 | 0.0 | 0.9 | NaN | NaN |
| 2011-05-25 14:06:00 | 22.537042 | 96.168046 | 6.7 | 246.2 | 133.0 | 0.0 | 0.9 | NaN | NaN |
| 2011-05-25 14:12:00 | 22.537179 | 96.168276 | 6.4 | 236.4 | 133.0 | 0.0 | 0.9 | NaN | NaN |
| 2011-05-25 14:18:00 | 22.537315 | 96.168506 | 6.1 | 226.6 | 133.0 | 0.0 | 0.9 | NaN | NaN |
| 2011-05-25 14:24:00 | 22.537452 | 96.168736 | 5.8 | 216.8 | 133.0 | 0.0 | 0.9 | NaN | NaN |
D:\C\Anaconda3\envs\ai4w_dataset\lib\site-packages\ai4water\datasets\mtropics.py:576: FutureWarning: Value based partial slicing on non-monotonic DatetimeIndexes with non-existing keys is deprecated and will raise a KeyError in a future Version.
  return wl.loc[st:en], spm.loc[st:en]
(5948, 9)
[18]:
df.head()
[18]:
| air_temp | rel_hum | wind_speed | sol_rad | water_level | pcp | susp_pm | Ecoli_source | Ecoli_mpn100 | |
|---|---|---|---|---|---|---|---|---|---|
| 2011-05-25 14:00:00 | 22.536906 | 96.167816 | 7.0 | 256.0 | 133.0 | 0.0 | 0.9 | NaN | NaN |
| 2011-05-25 14:06:00 | 22.537042 | 96.168046 | 6.7 | 246.2 | 133.0 | 0.0 | 0.9 | NaN | NaN |
| 2011-05-25 14:12:00 | 22.537179 | 96.168276 | 6.4 | 236.4 | 133.0 | 0.0 | 0.9 | NaN | NaN |
| 2011-05-25 14:18:00 | 22.537315 | 96.168506 | 6.1 | 226.6 | 133.0 | 0.0 | 0.9 | NaN | NaN |
| 2011-05-25 14:24:00 | 22.537452 | 96.168736 | 5.8 | 216.8 | 133.0 | 0.0 | 0.9 | NaN | NaN |
[19]:
print(df.isna().sum())
air_temp           0
rel_hum            0
wind_speed         0
sol_rad            0
water_level        0
pcp                0
susp_pm            0
Ecoli_source     105
Ecoli_mpn100    5690
dtype: int64
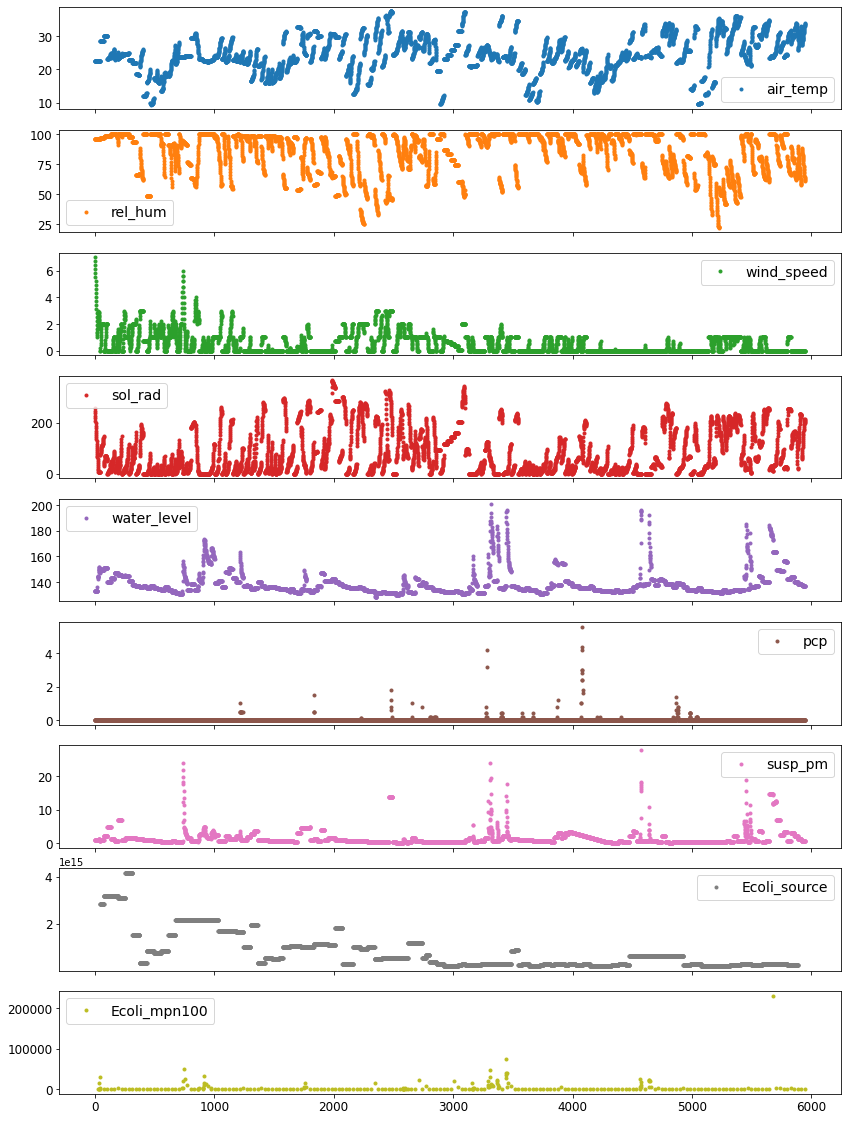
[20]:
eda = EDA(data=df)
eda.plot_data(subplots=True, figsize=(14, 20),
              ignore_datetime_index=True)
classification
D:\C\Anaconda3\envs\ai4w_dataset\lib\site-packages\ai4water\datasets\mtropics.py:576: FutureWarning: Value based partial slicing on non-monotonic DatetimeIndexes with non-existing keys is deprecated and will raise a KeyError in a future Version.
  return wl.loc[st:en], spm.loc[st:en]
(5948, 9)
[22]:
df.head()
[22]:
| air_temp | rel_hum | wind_speed | sol_rad | water_level | pcp | susp_pm | Ecoli_source | Ecoli_mpn100 | |
|---|---|---|---|---|---|---|---|---|---|
| 2011-05-25 14:00:00 | 22.536906 | 96.167816 | 7.0 | 256.0 | 133.0 | 0.0 | 0.9 | NaN | NaN |
| 2011-05-25 14:06:00 | 22.537042 | 96.168046 | 6.7 | 246.2 | 133.0 | 0.0 | 0.9 | NaN | NaN |
| 2011-05-25 14:12:00 | 22.537179 | 96.168276 | 6.4 | 236.4 | 133.0 | 0.0 | 0.9 | NaN | NaN |
| 2011-05-25 14:18:00 | 22.537315 | 96.168506 | 6.1 | 226.6 | 133.0 | 0.0 | 0.9 | NaN | NaN |
| 2011-05-25 14:24:00 | 22.537452 | 96.168736 | 5.8 | 216.8 | 133.0 | 0.0 | 0.9 | NaN | NaN |
[23]:
print(df.isna().sum())
air_temp           0
rel_hum            0
wind_speed         0
sol_rad            0
water_level        0
pcp                0
susp_pm            0
Ecoli_source     105
Ecoli_mpn100    5690
dtype: int64
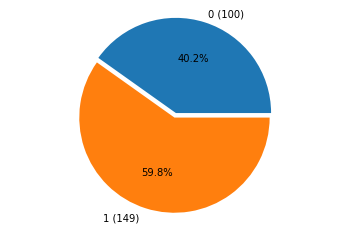
[26]:
_ = pie(df.dropna().iloc[:, -1].values.astype(int), explode=(0, 0.05))
ecoli_mekong
[6]:
ecoli = ecoli_mekong()
    Not downloading the data since the directory
    D:\mytools\AI4Water\ai4water\datasets\data\ecoli_houay_pano already exists.
    Use overwrite=True to remove previously saved files and download again

    Not downloading the data since the directory
    D:\mytools\AI4Water\ai4water\datasets\data\ecoli_mekong_2016 already exists.
    Use overwrite=True to remove previously saved files and download again

    Not downloading the data since the directory
    D:\mytools\AI4Water\ai4water\datasets\data\ecoli_mekong_loas already exists.
    Use overwrite=True to remove previously saved files and download again
Value based partial slicing on non-monotonic DatetimeIndexes with non-existing keys is deprecated and will raise a KeyError in a future Version.
[7]:
print(ecoli.shape)
(1602, 10)
[8]:
ecoli.isna().sum()
[8]:
station_name           0
T                     72
EC                    77
DOpercent            192
DO                   252
pH                   191
ORP                  349
Turbidity             63
TSS                  269
E-coli_4dilutions     58
dtype: int64
[9]:
ecoli.head()
[9]:
| station_name | T | EC | DOpercent | DO | pH | ORP | Turbidity | TSS | E-coli_4dilutions | |
|---|---|---|---|---|---|---|---|---|---|---|
| Date_Time | ||||||||||
| 2011-05-25 10:00:00 | Houay Pano | 24.11 | 273.0 | 87.5 | 7.34 | 7.67 | 53.5 | 13.47 | NaN | NaN |
| 2011-05-25 16:40:00 | Houay Pano | NaN | NaN | NaN | NaN | NaN | NaN | 1380.00 | 0.899281 | 1100.0 |
| 2011-05-25 17:06:00 | Houay Pano | NaN | NaN | NaN | NaN | NaN | NaN | 1116.00 | 0.993190 | 1400.0 |
| 2011-05-25 17:10:00 | Houay Pano | NaN | NaN | NaN | NaN | NaN | NaN | 1392.00 | 1.107880 | NaN |
| 2011-05-25 17:24:00 | Houay Pano | NaN | NaN | NaN | NaN | NaN | NaN | 702.00 | 1.325030 | 14000.0 |
[10]:
ecoli.tail()
[10]:
| station_name | T | EC | DOpercent | DO | pH | ORP | Turbidity | TSS | E-coli_4dilutions | |
|---|---|---|---|---|---|---|---|---|---|---|
| Date_Time | ||||||||||
| 2021-03-17 12:48:00 | Mekong | 32.95 | 180.0 | 105.20 | 8.63 | 7.55 | 50.9 | 1.58 | 0.003 | 2500.0 |
| 2021-03-27 11:58:00 | Mekong | 33.81 | 193.0 | 103.50 | 9.03 | 7.32 | 54.4 | 10.64 | 0.002 | 1800.0 |
| 2021-04-06 09:30:00 | Mekong | 29.44 | 289.0 | 94.00 | 7.17 | 7.07 | 238.1 | 22.00 | 0.001 | 2200.0 |
| 2021-04-20 12:33:00 | Mekong | 25.51 | 180.0 | 86.24 | 6.48 | 6.88 | 296.7 | 11.13 | 0.027 | 1600.0 |
| 2021-05-25 12:22:00 | Mekong | 24.26 | 166.0 | 78.50 | 6.12 | 6.92 | 302.7 | 8.69 | 0.007 | 1000.0 |
[13]:
ecoli.dropna().shape
[13]:
(982, 10)
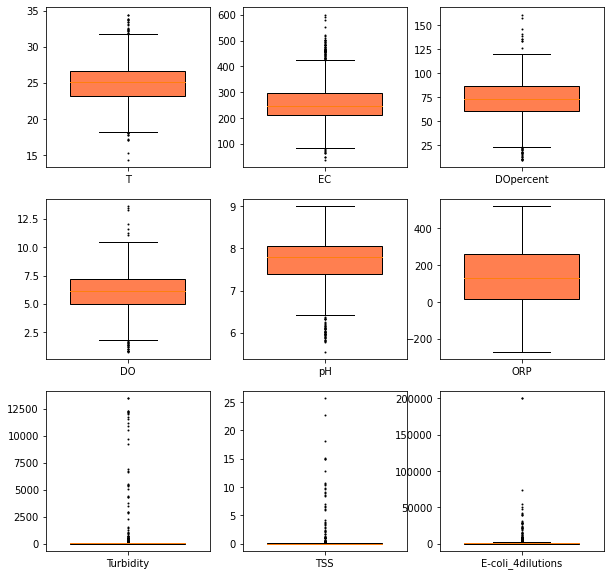
[22]:
_ = boxplot(ecoli.dropna().iloc[:, 1:], share_axes=False,
            fill_color="coral", patch_artist=True,
           figsize=(10, 10),
            flierprops={"ms": 1.0},
            widths=0.7
           )
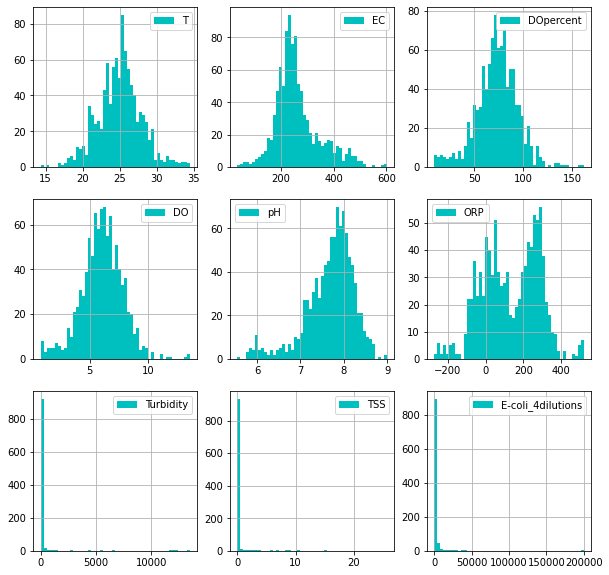
[32]:
_ = hist(
    ecoli.dropna().iloc[:, 1:],
    share_axes=False,
    color = 'c',
    bins=50,
    subplots_kws = dict(figsize=(10, 10))
)
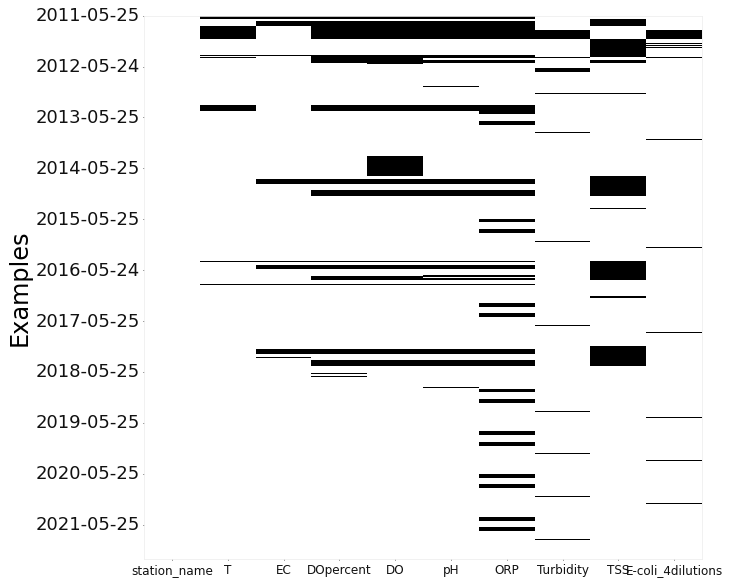
[34]:
_ = EDA(ecoli).heatmap(figsize=(10, 10))
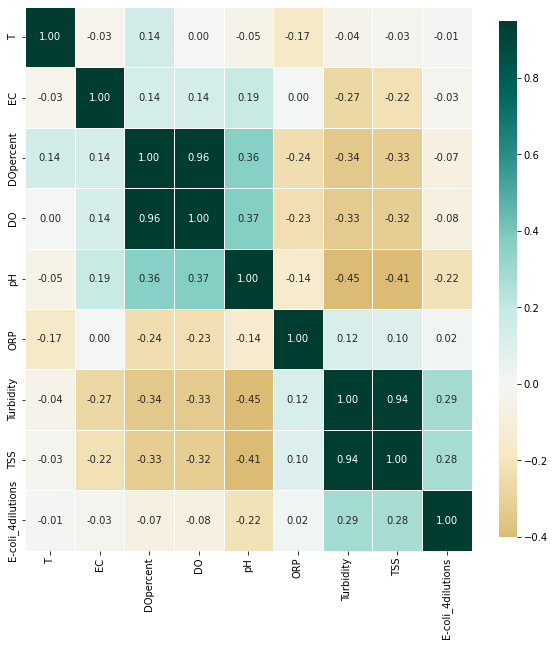
[31]:
_ = EDA(ecoli.dropna()).correlation(figsize=(10, 10))